Discovery Bay Q3 2026 Market Report
The period at a glance
| Metric | Q3 2026 |
|---|---|
| Total closings | 57 |
| Total volume | $46,809,967 |
| Median sale price | $745,780 |
| Median price per sq ft | $345 |
| Median square footage | 2,178 |
| Median lot size | 7,100 sq ft |
| Price range | $463,000 – $1,650,000 |
| Median days on market | 33 (reported on 52 of 57 closings) |
| Longest DOM | 162 days |
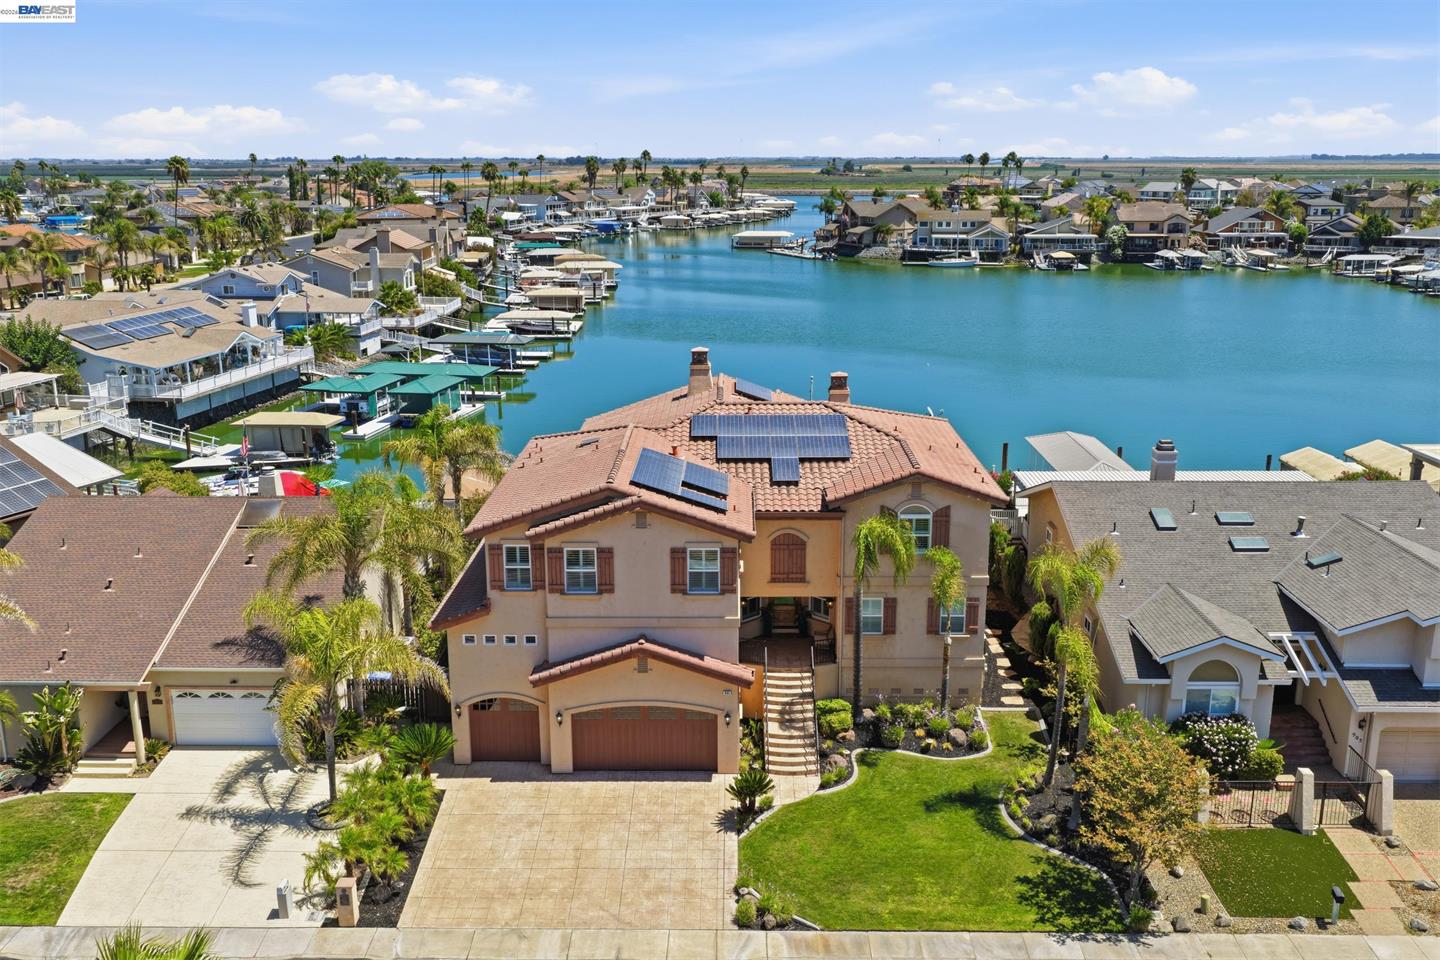
Fifty-seven closings across July, August, and September produced a quarter-wide median of $745,780 and $345 per square foot. The overall figures, though, smooth over a pattern that runs through nearly every segment: the homes that commanded the highest per-square-foot prices were, more often than not, the smaller ones. The eight closings in the $1M–$1.5M band carried a median of $465 per square foot, well above the 47 closings under $1M at $329. That gap reflects not just price-tier differences but a recurring observation in the roster—older, modestly sized homes with waterfront or water-adjacent positions extracted premiums that newer, larger homes did not.
Days on market were reported on 52 of the 57 closings. Of those, 10 closed in under seven days and 17 took more than 60, a distribution wide enough that the 33-day median understates the variation. Roughly one in three closings with a recorded DOM sat on the market for more than two months. List prices were not available for this period, so no comparison against asking price is possible.
The sales
The table below shows the top 40 closings by price. The full quarter recorded 57 closings.
| Address | Closed | Beds | Sq Ft | $/Sq Ft | Sale Price | DOM |
|---|---|---|---|---|---|---|
| 885 Willow Lake Rd | Aug 27 | 5 | 4,062 | $406 | $1,650,000 | 5 |
| 96 Shell Place | Sep 11 | 5 | 4,784 | $334 | $1,600,000 | 112 |
| 5761 Salmon Ct | Aug 27 | 4 | 2,711 | $535 | $1,450,000 | 162 |
| 4105 Windward Ct | Jul 21 | 3 | 2,615 | $517 | $1,353,000 | 118 |
| 952 Lido | Jul 13 | 4 | 3,170 | $405 | $1,285,000 | 143 |
| 5561 Beaver Lane | Jul 21 | 4 | 2,715 | $449 | $1,220,000 | 6 |
| 412 Lakehead Ct | Jul 6 | 5 | 4,218 | $285 | $1,200,000 | 13 |
| 5621 Starboard Dr | Aug 27 | 3 | 2,284 | $482 | $1,100,000 | 101 |
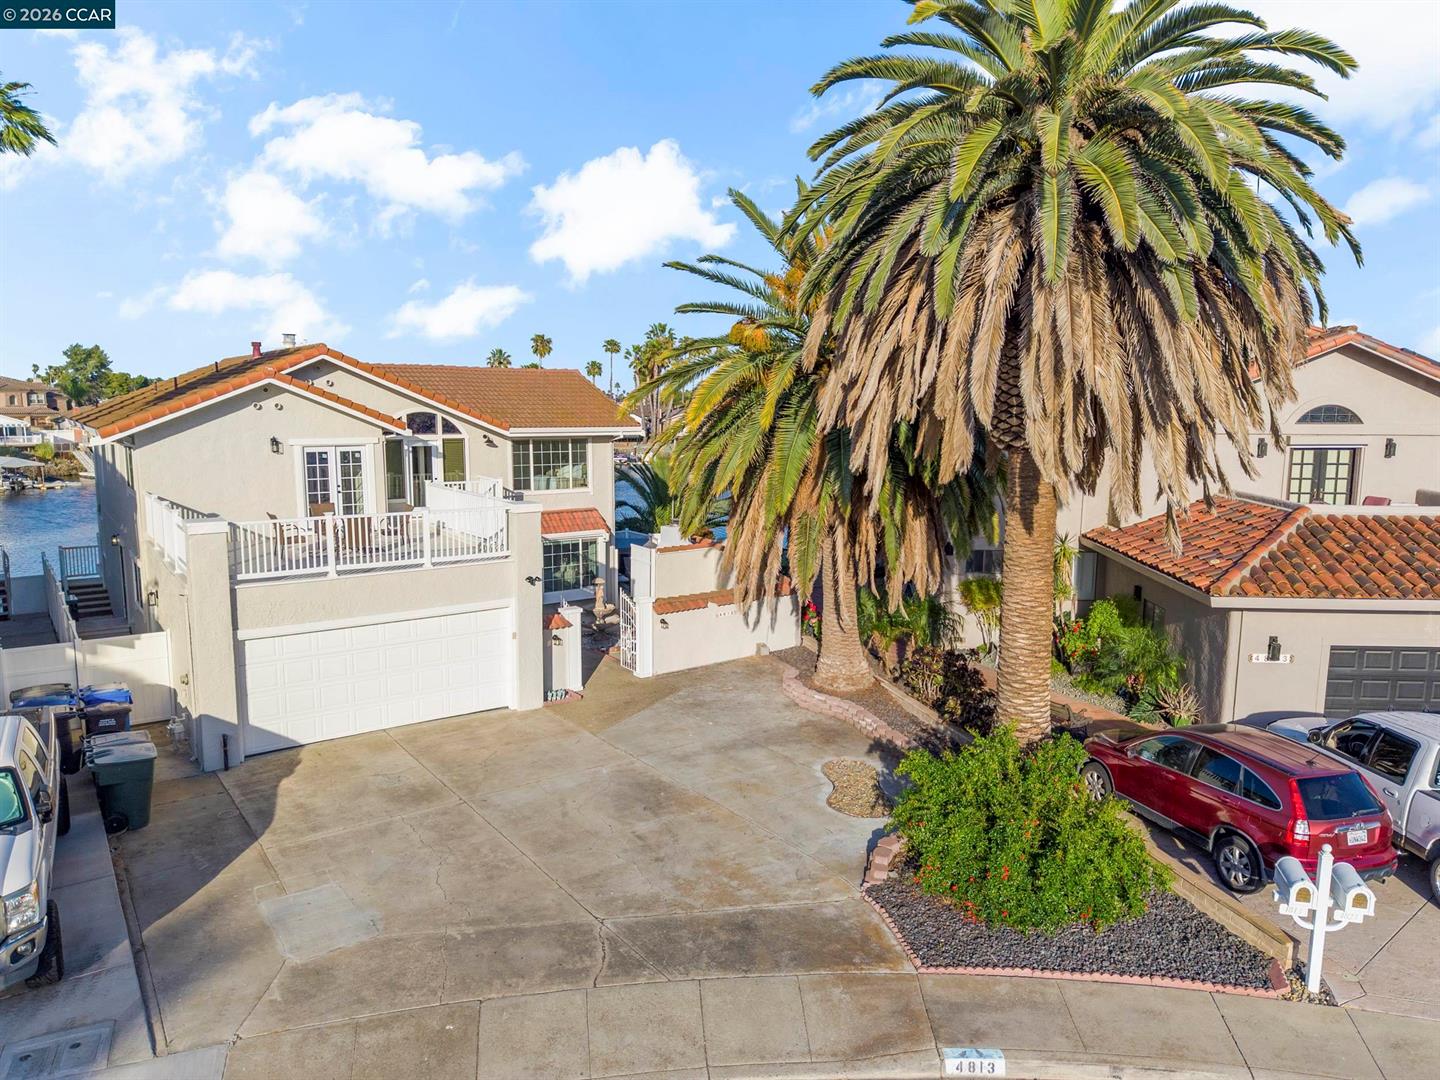
| 4813 South Pt | Aug 28 | 4 | 2,871 | $373 | $1,070,000 | 79 |
| 1215 Willow Lake Rd | Aug 28 | 3 | 1,682 | $624 | $1,050,000 | 36 |
| 4839 Cabrillo Pt | Aug 26 | 3 | 1,763 | $547 | $965,000 | 98 |
| 2055 Cypress Pt | Jul 14 | 4 | 2,997 | $322 | $965,000 | 8 |
| 5880 Starboard Dr | Jul 23 | 4 | 2,242 | $424 | $950,000 | 3 |
| 5671 Arcadia Cir | Sep 23 | 6 | 4,679 | $202 | $945,000 | 17 |
| 2008 Windward Pt | Jul 31 | 3 | 2,490 | $363 | $903,000 | 99 |
| 840 Rainbow Ct | Aug 3 | 3 | 2,342 | $378 | $885,000 | 47 |
| 1020 Bluebell Circle | Jul 15 | 5 | 3,420 | $257 | $879,000 | 111 |
| 1771 Wilde Dr | Sep 30 | 5 | 2,888 | $301 | $870,000 | 51 |
| 1760 Anchorage Way | Aug 17 | 3 | 1,668 | $515 | $859,000 | 52 |
| 1794 Seal Way | Aug 21 | 3 | 2,153 | $395 | $850,000 | 22 |
| 3438 Keystone Loop | Jul 21 | 6 | 4,088 | $208 | $849,900 | 27 |
| 5619 Berwick Ct | Jul 9 | 3 | 2,172 | $384 | $835,000 | 5 |
| 834 Blue Mesa Court | Sep 7 | 4 | 3,030 | $272 | $824,000 | 78 |
| 2259 Newport Ct | Sep 30 | 4 | 2,136 | $373 | $797,000 | — |
| 5282 Fern Ridge Cir | Aug 24 | 5 | 3,629 | $219 | $795,500 | 159 |
| 8012 Westport Cir | Jul 13 | 4 | 2,695 | $284 | $765,000 | 5 |
| 5250 Edgeview Dr | Aug 18 | 3 | 2,123 | $360 | $765,000 | 9 |
| 1915 Edgeview Way | Aug 19 | 4 | 2,585 | $290 | $750,000 | 12 |
| 586 Lee Loop | Sep 28 | 4 | 2,178 | $342 | $745,780 | 124 |
| 9261 Shearwater Circle | Sep 2 | 3 | 2,106 | $354 | $745,000 | 8 |
| 1525 Coleridge Way | Sep 4 | 4 | 2,704 | $276 | $745,000 | 29 |
| 6372 Crystal Springs Cir | Jul 7 | 5 | 3,092 | $239 | $740,000 | 78 |
| 2459 Pacific Grove Ct | Jul 29 | 4 | 1,760 | $415 | $730,000 | 5 |
| 5539 Arcadia Cir | Sep 21 | 5 | 3,333 | $219 | $730,000 | — |
| 1024 Bluebell Circle | Jul 3 | 4 | 2,091 | $344 | $719,000 | 38 |
| 5501 Riverlake Road | Aug 18 | 4 | 2,305 | $310 | $715,000 | 58 |
| 5470 Gold Creek Circle | Sep 13 | 4 | 1,865 | $369 | $688,888 | 20 |
| 2466 Yosemite Way | Aug 18 | 4 | 2,613 | $260 | $680,000 | 2 |
| 1755 Surfside Ct | Aug 13 | 3 | 1,689 | $401 | $677,500 | 53 |
| 5141 Fern Ridge Cir | Jul 10 | 5 | 3,333 | $203 | $675,000 | 84 |
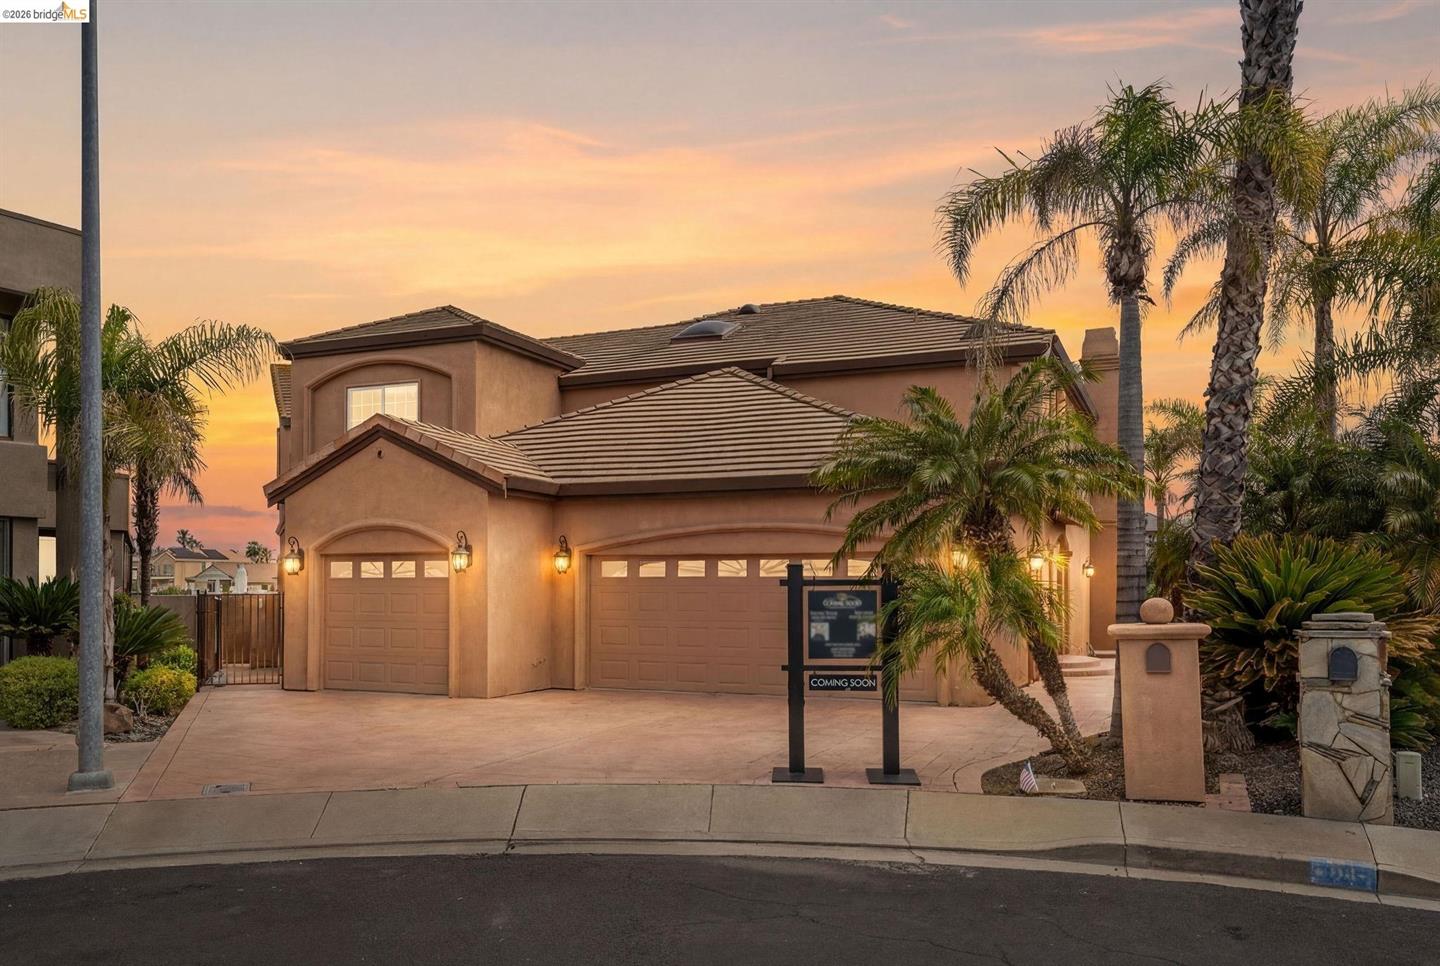
Four transactions stand out as anchors for the quarter's character.
885 Willow Lake Road closed at $1,650,000 in five days—the fastest close among the top ten by price and the quarter's high-water mark. At 4,062 square feet on a 9,000-square-foot lot, it logged $406 per square foot. Five days from listing to contract suggests this one met its buyer before most alternatives were evaluated.
5761 Salmon Court tells a different story. It closed at $1,450,000—third highest in the quarter—but carried a 162-day DOM, the longest recorded. At $535 per square foot on 2,711 square feet, the per-foot price exceeded the top-priced sale. The 162-day arc suggests the home and the market needed time to agree on terms.
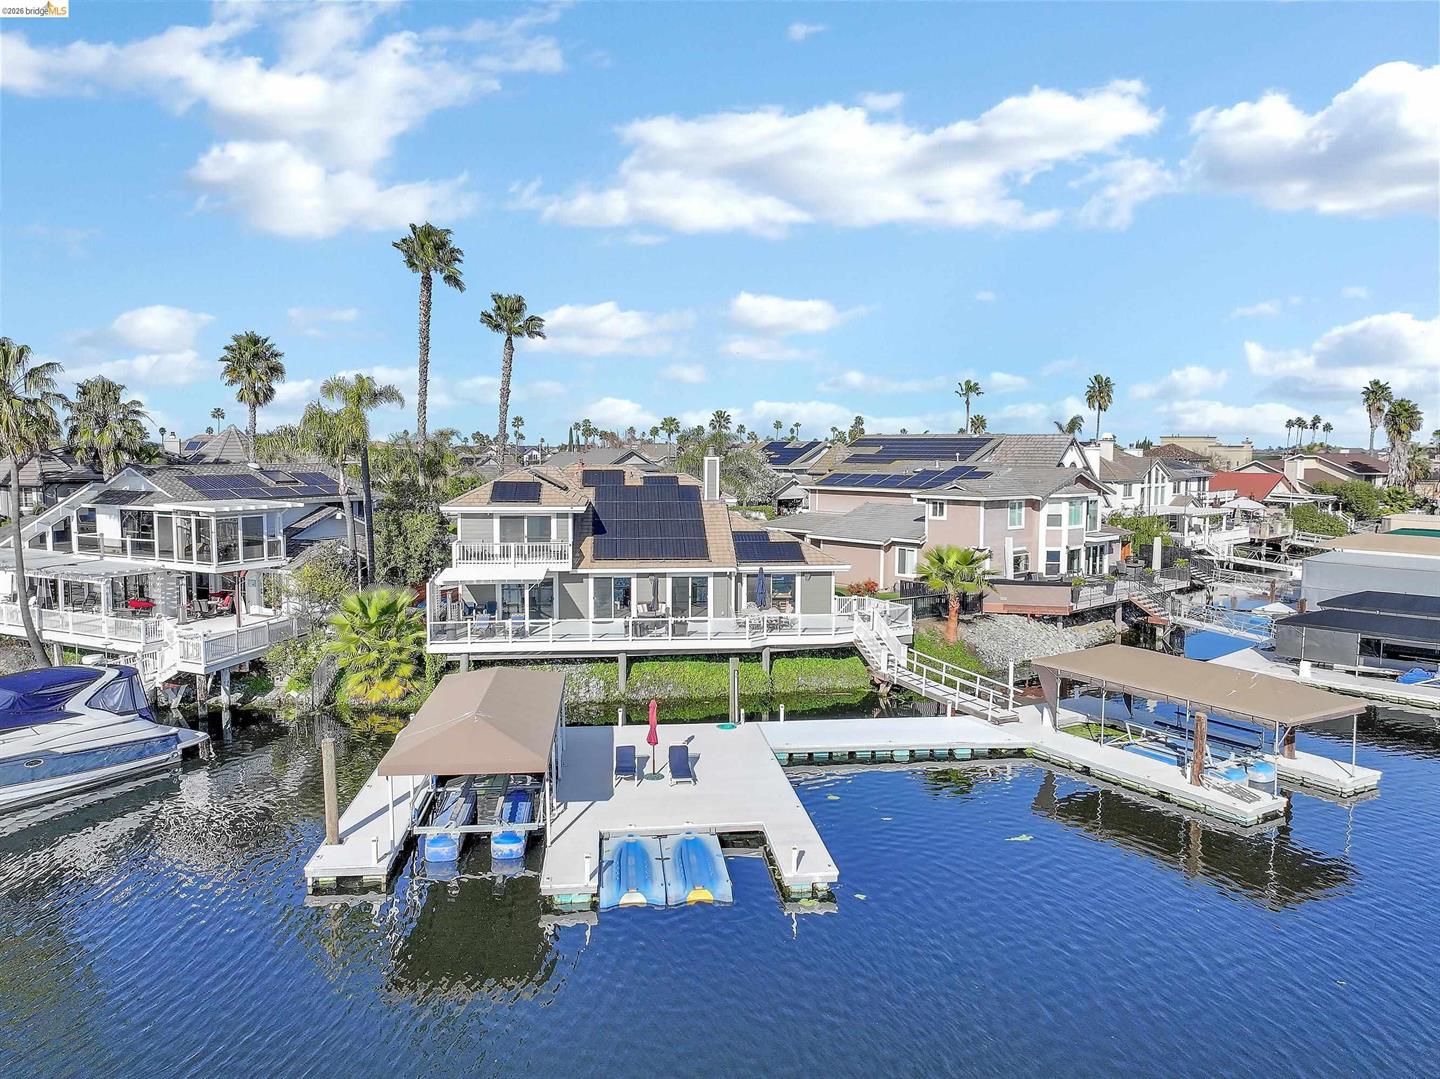
1215 Willow Lake Road posted the quarter's highest price per square foot at $624 on a 1,682-square-foot home that closed at $1,050,000 in 36 days. That figure—$624 per foot on a 1981-built home—sits well above the segment median of $343. The address, also on Willow Lake Road, points to water proximity as a factor the raw square footage alone does not explain.
5671 Arcadia Circle closed at $945,000 on 4,679 square feet, producing $202 per square foot—the second-lowest per-foot figure in the top 40. A 17-day DOM suggests the price was not the obstacle. The spread between that result and Willow Lake Road's $624, within the same quarter and same segment, defines the range that single-family buyers and sellers navigated.
Where the market split
By segment
| Segment | Closings | Median Price | Median $/Sq Ft | Median Sq Ft | Price Range |
|---|---|---|---|---|---|
| Single Family | 52 | $765,000 | $343 | 2,295 | $500,000–$1,650,000 |
| Condominium | 3 | $475,000 | $353 | 1,312 | $463,000–$484,000 |
| Townhouse | 2 | $535,000 | — | 1,407 | $480,000–$590,000 |
Single-family homes accounted for 52 of the 57 closings and the full spread of the market. Their $765,000 median rests on a substantial sample. Condominiums recorded three closings—enough for a median ($475,000) but not a trend; the range was tight, $463,000 to $484,000, and per-foot at $353 sat fractionally above the single-family figure. Townhouses recorded only two closings ($480,000 and $590,000); with fewer than three sales, no median is presented—the range is the more honest read.
The per-square-foot inversion is worth noting within single-family: a segment median of $343 overall, but with the highest-volume price band (under $1M, 47 closings) at $329 per foot, and the mid-tier band ($1M–$1.5M, 8 closings) at $465. Buyers paying more per dollar were, on average, getting less square footage but something else—location, lot position, or vintage—that the aggregate does not separate out.
By price band
| Price Band | Closings | Median $/Sq Ft |
|---|---|---|
| Under $1M | 47 | $329 |
| $1M–$1.5M | 8 | $465 |
| $1.5M–$2M | 2 | $370 |
The under-$1M band absorbed 82% of the quarter's closings. The $1M–$1.5M band's $465 median per foot is the highest of any tier, outpacing even the $1.5M–$2M band at $370. The top band holds only two sales (885 Willow Lake Road and 96 Shell Place), so its $370 median is arithmetic, not a pattern—one home at $406/sqft, one at $334/sqft, two very different results.
Nothing closed above $1.65M and nothing closed below $463,000. The absence of activity above $1.65M is a factual boundary of the quarter, not a ceiling implied by anything other than what the record shows.
Across the quarter
| Month | Closings | Median Price | Median $/Sq Ft |
|---|---|---|---|
| Jul 2026 | 21 | $765,000 | $344 |
| Aug 2026 | 19 | $795,500 | $378 |
| Sep 2026 | 17 | $730,000 | $329 |
July opened the quarter at a $765,000 median on 21 closings. August moved the median up to $795,500—the quarter's high-water mark by that measure—on 19 closings and the strongest per-foot reading at $378. September pulled both figures back: $730,000 median and $329 per foot on 17 closings, the lowest per-foot month of the three.
Closing volume stepped down month by month: 21, 19, 17. Whether that reflects seasonal rhythm, listing availability, or something else in the pipeline is not answerable from the closing record alone. What the record shows is that the quarter's top median month (August) and bottom median month (September) were separated by $65,500 and 49 dollars per square foot—a meaningful spread across a single quarter in a market where the full-period median sat at $745,780.
Several of September's closings came with long DOM figures originating in the spring—586 Lee Loop at 124 days, 96 Shell Place at 112 days, 586 Lee Loop and 1771 Wilde Dr at 51 days. Homes that struggled to find buyers earlier in the year settled in September; that mix contributed to the month's softer per-foot reading.
What it means
For sellers. The quarter's record separates quickly into two experiences. Homes that closed in under a week—ten of them—and homes that required more than two months—seventeen. The difference was not simply price; 5761 Salmon Court took 162 days and still closed at $1.45M. Size appears to have mattered less than location and specific property characteristics in determining both pace and per-foot outcome. The median of $343 per square foot for single-family homes across 52 closings is the clearest benchmark the quarter produced.
For buyers. The under-$1M band contained 47 of 57 closings, with a median per-foot of $329 and price points from $500,000 into the mid-$900s. Within that band, per-foot varied from around $200 to more than $600, depending on size and address. Larger homes on the Arcadia Circle corridor—5671 at $202/sqft, 5539 at $219/sqft—closed at figures substantially below the band median on a per-foot basis. Smaller homes near water closed at the opposite end. The quarter's DOM distribution—10 under seven days, 17 over 60—indicates that some properties found buyers quickly while others accumulated time on the market without resolution until price or terms adjusted.
For owners not transacting. Fifty-seven closings across three months in a community of Discovery Bay's size represents an active quarter. Total volume of $46.8 million spread across a $463,000-to-$1,650,000 range. The quarter's median of $745,780 on 2,178 square feet puts the per-foot figure at $345 for the period as a whole. August was the strongest month on both median price and per-foot measures; September the softest. The direction between those two months is what the record shows; what comes next is not in the data.
Tim McMullen · CA DRE #02016832
[email protected] · (415) 691-9272
Press kit: figures & citation for this report →
More Discovery Bay market reports
Discovery Bay September 2026 Market Report
Discovery Bay Posts 17 Closings in September as Median Price Slips to $730,000 — the Lowest in Six Months
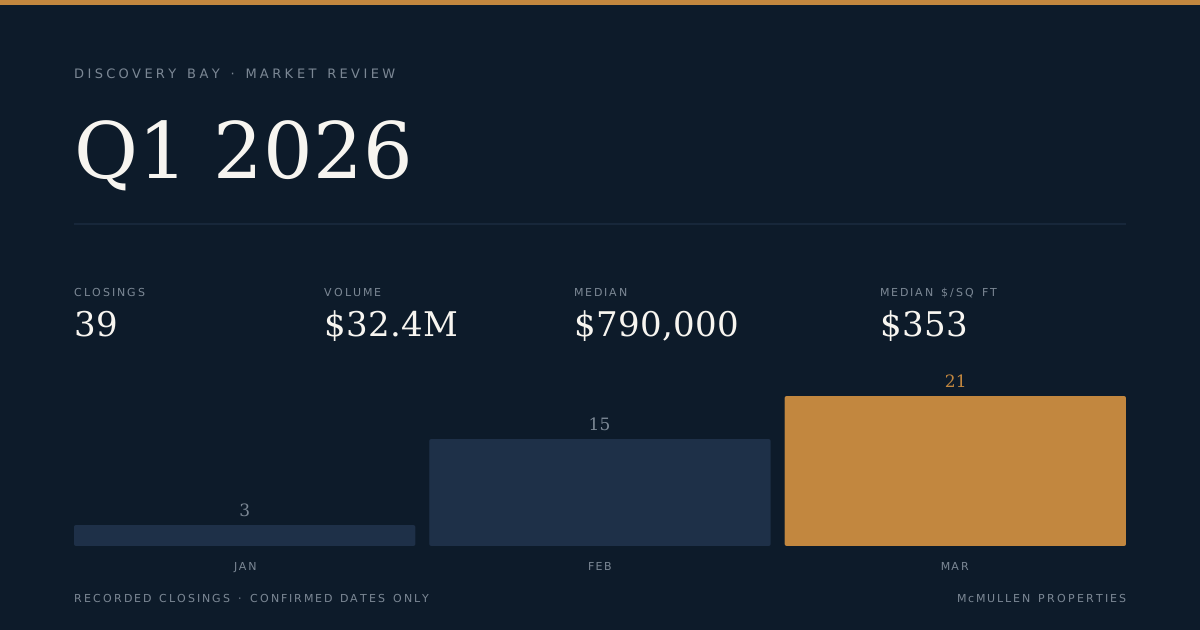
Discovery Bay Q1 2026 Market Report
Discovery Bay Posts $32.4M in Q1 2026 Closings as Median Price Slips $119K from January to March
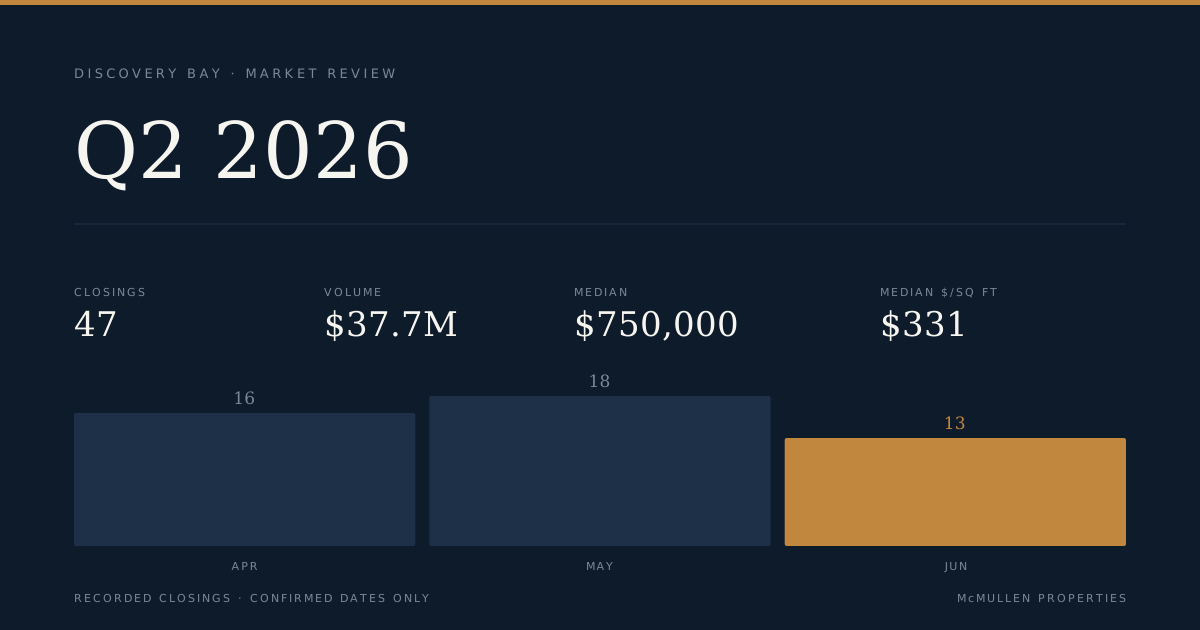
Discovery Bay Q2 2026 Market Report
Discovery Bay Q2 2026: 47 Closings, $37.7M in Volume, With a $1.1M Gap Between the Segment Medians