Discovery Bay Q2 2026 Market Report
The period at a glance
| Metric | Q2 2026 |
|---|---|
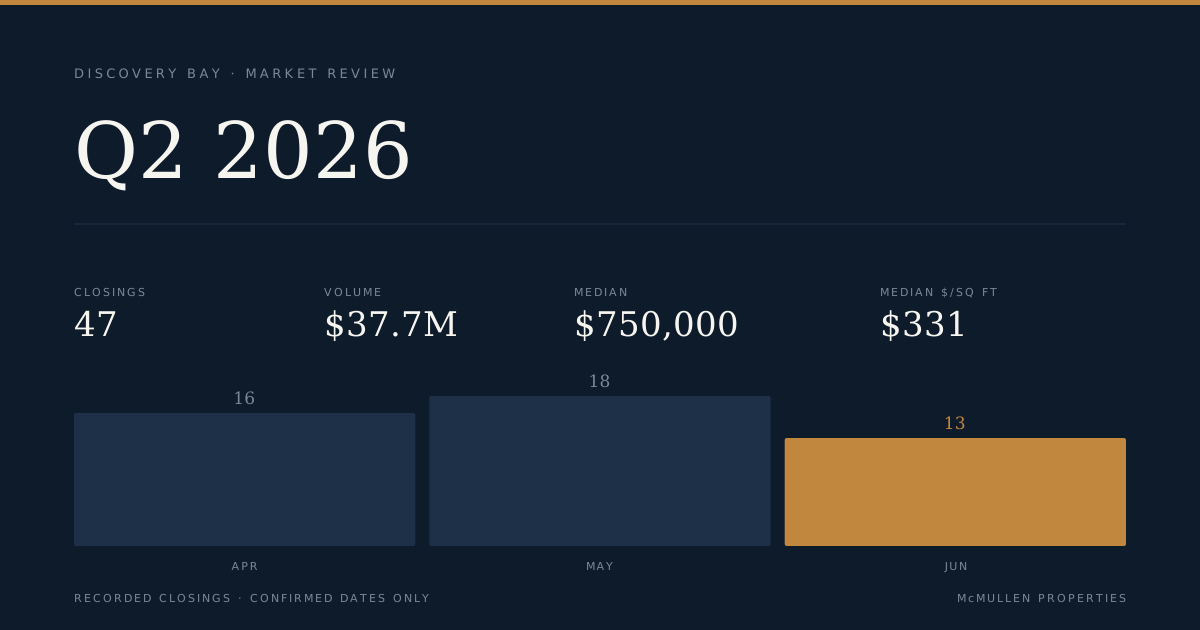
| Total closings | 47 |
| Total volume | $37,682,703 |
| Overall median price | $750,000 |
| Overall median price per sq ft | $331 |
| Overall median sq ft | 2,178 |
| Median lot size | 6,861 sq ft |
| Price range | $427,000 – $1,650,000 |
| Median days on market* | 22 days (reported on all 47 closings) |
*List prices are not available in the source data for this period.
Forty-seven closings between April 1 and June 30, 2026 produced a quarter-wide median sale price of $750,000 and a median of $331 per square foot across 47 transactions. Days on market were recorded for all 47 closings, giving the speed picture unusual completeness: the median sat at 22 days, but the distribution deserves attention. Seventeen closings finished in 8 to 21 days and five closed in under seven days, while 13 took longer than 60 days — including one that spent 300 days in the market before recording on April 17. That long tail is not statistical noise; it pulled the upper end of the range substantially away from the median and illustrates that two very different pacing patterns coexisted across the same quarter.
June closed with the quarter's highest monthly median price per square foot at $387, up from $334 in April and $330 in May, though June also logged the fewest closings of the three months at 13. The overall median price rose from $709,500 in April to $784,250 in May and $789,000 in June — a $79,500 move from the first month to the last on a base of 16, 18, and 13 closings respectively.
The sales
The table below shows the top 40 closings by price. The full quarter counted 47 recorded transactions.
| Address | Segment | Beds | Sq Ft | Year Built | Sale Price | $/Sq Ft | DOM |
|---|---|---|---|---|---|---|---|
| 3982 Bolinas Pl | Single Family | 4 | 2,957 | 1999 | $1,650,000 | $558 | 67 |
| 5890 Starboard Dr | Single Family | 4 | 3,361 | 2001 | $1,510,000 | $449 | 7 |
| 936 Lido Circle | Single Family | 4 | 3,315 | 1975 | $1,372,500 | $414 | 11 |
| 4859 Cabrillo Pt | Single Family | 3 | 2,245 | 1977 | $1,350,000 | $601 | 7 |
| 4882 Cabrillo Pt | Single Family | 3 | 3,407 | 1975 | $1,320,000 | $387 | 11 |
| 1864 Dune Point Way | Single Family | 3 | 1,524 | 1985 | $990,000 | $650 | 182 |
| 6144 Seneca Cir | Single Family | 5 | 3,714 | 2005 | $950,000 | $256 | 60 |
| 1432 Willow Lake Rd | Single Family | 4 | 2,252 | 1978 | $915,000 | $406 | 9 |
| 5647 Arcadia Circle | Single Family | 5 | 3,139 | 2004 | $879,000 | $280 | 11 |
| 2287 Cove Ct | Single Family | 3 | 1,814 | 1988 | $875,500 | $483 | 107 |
| 4731 Spinnaker Way | Single Family | 3 | 1,814 | 1986 | $853,000 | $470 | 9 |
| 5770 Gateway Ct | Single Family | 4 | 2,595 | 1989 | $845,000 | $326 | 59 |
| 9466 Davenport Cir | Single Family | 3 | 2,296 | 2017 | $835,000 | $364 | 22 |
| 9253 Shearwater Cir | Single Family | 5 | 2,725 | 2020 | $830,000 | $305 | 6 |
| 9078 Tradewinds Cir | Single Family | 4 | 2,503 | 2019 | $825,000 | $330 | 18 |
| 4630 Spinnaker Way | Single Family | 3 | 1,543 | 1985 | $820,000 | $531 | 23 |
| 3432 Keystone Loop | Single Family | 5 | 4,011 | 2003 | $818,000 | $204 | 40 |
| 2350 Winchester Loop | Single Family | 4 | 2,913 | 2003 | $800,000 | $275 | 16 |
| 5502 Drakes Ct | Single Family | 4 | 2,131 | 1979 | $799,000 | $375 | 11 |
| 1090 Saint Andrews Dr | Single Family | 3 | 1,931 | 1987 | $789,000 | $409 | 2 |
| 554 Lee Loop | Single Family | 3 | 2,335 | 2025 | $769,500 | $330 | 170 |
| 2265 Newport Court | Single Family | 3 | 1,768 | 1992 | $764,000 | $432 | 13 |
| 4596 Cove Ln | Single Family | 3 | 2,420 | 1991 | $755,000 | $312 | 27 |
| 716 Seminole Court | Single Family | 4 | 3,517 | 2003 | $750,000 | $213 | 97 |
| 327 Mendocino Way | Single Family | 4 | 3,097 | 2003 | $740,000 | $239 | 13 |
| 1145 Bradbury Dr | Single Family | 4 | 2,335 | 2024 | $738,398 | $316 | 300 |
| 8301 Brookhaven Circle | Single Family | 3 | 1,886 | 2014 | $735,000 | $390 | 15 |
| 550 Lee Loop | Single Family | 3 | 2,178 | 2025 | $721,305 | $331 | 168 |
| 5675 Arcadia Cir | Single Family | 4 | 3,333 | 2004 | $720,000 | $216 | 11 |
| 351 Astilbe Street | Single Family | 3 | 1,708 | 2025 | $699,000 | $409 | 287 |
| 9901 Pyramid Way | Single Family | 3 | 1,869 | 2013 | $695,500 | $372 | 15 |
| 8219 Brookhaven Cir | Single Family | 5 | 2,342 | 2015 | $690,000 | $295 | 22 |
| 2072 Bridgeport Loop | Single Family | 4 | 2,302 | 2003 | $690,000 | $300 | 80 |
| 4010 Goleta Pl | Single Family | 5 | 2,136 | 1993 | $675,000 | $316 | 39 |
| 2430 Bodega Court | Single Family | 3 | 1,795 | 1991 | $674,000 | $375 | 19 |
| 2337 Newport Place South | Single Family | 3 | 1,768 | 1993 | $655,000 | $370 | 95 |
| 2675 Cherry Hills Dr | Single Family | 3 | 2,212 | 1991 | $650,000 | $293 | 65 |
| 3749 Sailboat Dr | Single Family | 4 | 2,042 | 1999 | $639,000 | $313 | 65 |
| 2205 Breaker Ct | Single Family | 4 | 1,897 | 1987 | $639,000 | $337 | 54 |
| 3716 Catamaran Ct | Single Family | 3 | 1,706 | 1997 | $600,000 | $352 | 119 |
The quarter's high-water mark, 3982 Bolinas Pl, recorded at $1,650,000 — $558 per square foot on a 1999-built, 4-bedroom home — after 67 days in the market. That price per square foot is the second-highest in the top-40 roster behind 4859 Cabrillo Pt, which closed at $601 per square foot on just 7 days of market exposure, though on a smaller footprint of 2,245 square feet and at $1,350,000. The Cabrillo Pt corridor produced two of the quarter's top five closings: 4882 Cabrillo Pt also cleared $1.32 million in 11 days — different bedroom count, very similar vintage (1975), and a substantially larger floor plan at 3,407 square feet at $387 per square foot.
At the opposite end of the speed range, 1145 Bradbury Dr logged 300 days before closing at $738,398 — a 2024-built home that spent nearly ten months on record before recording April 17. Two 2025-built homes on Lee Loop — 554 and 550 — required 170 and 168 days respectively and closed at $769,500 and $721,305. All three of these new-construction closings carried above-median price per square foot ($316–$331) but moved measurably slower than the broader quarter median of 22 days. Separately, 1864 Dune Point Way, a 1985-built three-bedroom at 1,524 square feet, closed at $990,000 — the quarter's highest price per square foot in the recorded dataset at $650 — after 182 days.
Where the market split
By segment (all three segments)
| Segment | Closings | Median Price | Median $/Sq Ft | Median Sq Ft | Price Range |
|---|---|---|---|---|---|
| Single Family | 44 | $759,500 | $334 | 2,229 | $520,000 – $1,650,000 |
| Townhouse | 2 | $458,500 | $315 | 1,460 | $427,000 – $490,000 |
| Condominium | 1 | — | $503 | 1,152 | $580,000 |
Single family was the engine of the quarter at 44 of 47 closings, with a median price of $759,500 and a median of $334 per square foot across a sample that ran from $520,000 to $1,650,000. The two townhouse closings ($427,000 and $490,000) are too few to support a median in any meaningful statistical sense; the range is $427,000 to $490,000, spanning a gap of $63,000. The single condominium closing recorded at $580,000 — one transaction does not carry a segment median, only the data point itself: 1,152 square feet at $503 per square foot.
The gap between the single-family median and the top of the townhouse range is $269,500. That gap is not a commentary on relative quality; it is the recorded distance between the two segments as transaction data shows it this quarter.
By price band
| Band | Closings | Median $/Sq Ft |
|---|---|---|
| Under $1M | 42 | $328 |
| $1M – $1.5M | 3 | $414 |
| $1.5M – $2M | 2 | $504 |
Ninety-three percent of the quarter's 47 closings — 42 transactions — landed under $1 million, with a median of $328 per square foot. The $1M–$1.5M band held three closings (936 Lido Circle, 4859 Cabrillo Pt, 4882 Cabrillo Pt), enough for a median of $414 per square foot. The $1.5M–$2M band carried only two closings — 3982 Bolinas Pl and 5890 Starboard Dr — at a median of $504 per square foot. No closings recorded above $1,650,000 this quarter.
The per-square-foot step from under-$1M to the $1.5M–$2M band is $176, or a 54% premium. Whether that reflects location, condition, waterfront access, or some other characteristic cannot be determined from the closing record alone.
Across the period
| Month | Closings | Median Price | Median $/Sq Ft |
|---|---|---|---|
| April 2026 | 16 | $709,500 | $334 |
| May 2026 | 18 | $784,250 | $330 |
| June 2026 | 13 | $789,000 | $387 |
April opened the quarter with 16 closings at a median of $709,500. May added 18 closings — the most active month — at $784,250, a $74,750 move in the monthly median. June recorded the fewest closings at 13 but carried the highest monthly median price ($789,000) and the highest median per square foot ($387). The per-square-foot median held nearly flat from April ($334) to May ($330) before jumping in June. Given that June's sample is 13 transactions, a handful of larger closings near the top of the range have proportionally more weight on that month's figures than they would in a deeper sample.
The quarter's distribution by time on market tells a parallel story across all 47 recorded closings: five closed in under seven days, 17 in 8–21 days, 12 in 22–60 days, and 13 over 60 days. The longest single DOM recorded was 300 days. The median of 22 days sits between the fast-moving group and the long-tail group rather than describing either cleanly.
What it means
For sellers
The quarter produced $37.7 million in recorded volume across 47 closings, with a single-family median of $759,500 (44 transactions). The upper price bands — $1M to $1.5M and $1.5M to $2M — accounted for five closings combined, and all five closed between April 15 and June 26, distributed across the full quarter. The longest time-on-market figures in the roster included both new construction (300, 287, 170, and 168 days) and older resale stock (182 and 107 days), suggesting that extended market exposure was not confined to any single vintage or price point.
For buyers
Forty-two of 47 closings came in under $1 million, with a median of $328 per square foot in that band. The under-$1M segment ranged from $520,000 to just under seven figures, with a median square footage of 2,229 for single-family homes across the full quarter. Thirteen closings took longer than 60 days to record — more than one in four of the quarter's transactions — while five closed in under a week. Both patterns existed simultaneously in the same quarter and the same price bands.
For owners not transacting
The quarter-wide median of $750,000 across all 47 closings represents the midpoint of a recorded distribution that ran from $427,000 to $1,650,000 — a range of $1,223,000. The month-by-month data shows the median moving from $709,500 in April to $789,000 in June on progressively fewer closings. Whether June's higher figures reflect the specific mix of homes that closed that month or a broader directional shift is a question the next quarter's data will address.
Tim McMullen · Tim McMullen, Broker · CA DRE #02016832
[email protected] · (415) 691-9272
Press kit: figures & citation for this report →
More Discovery Bay market reports
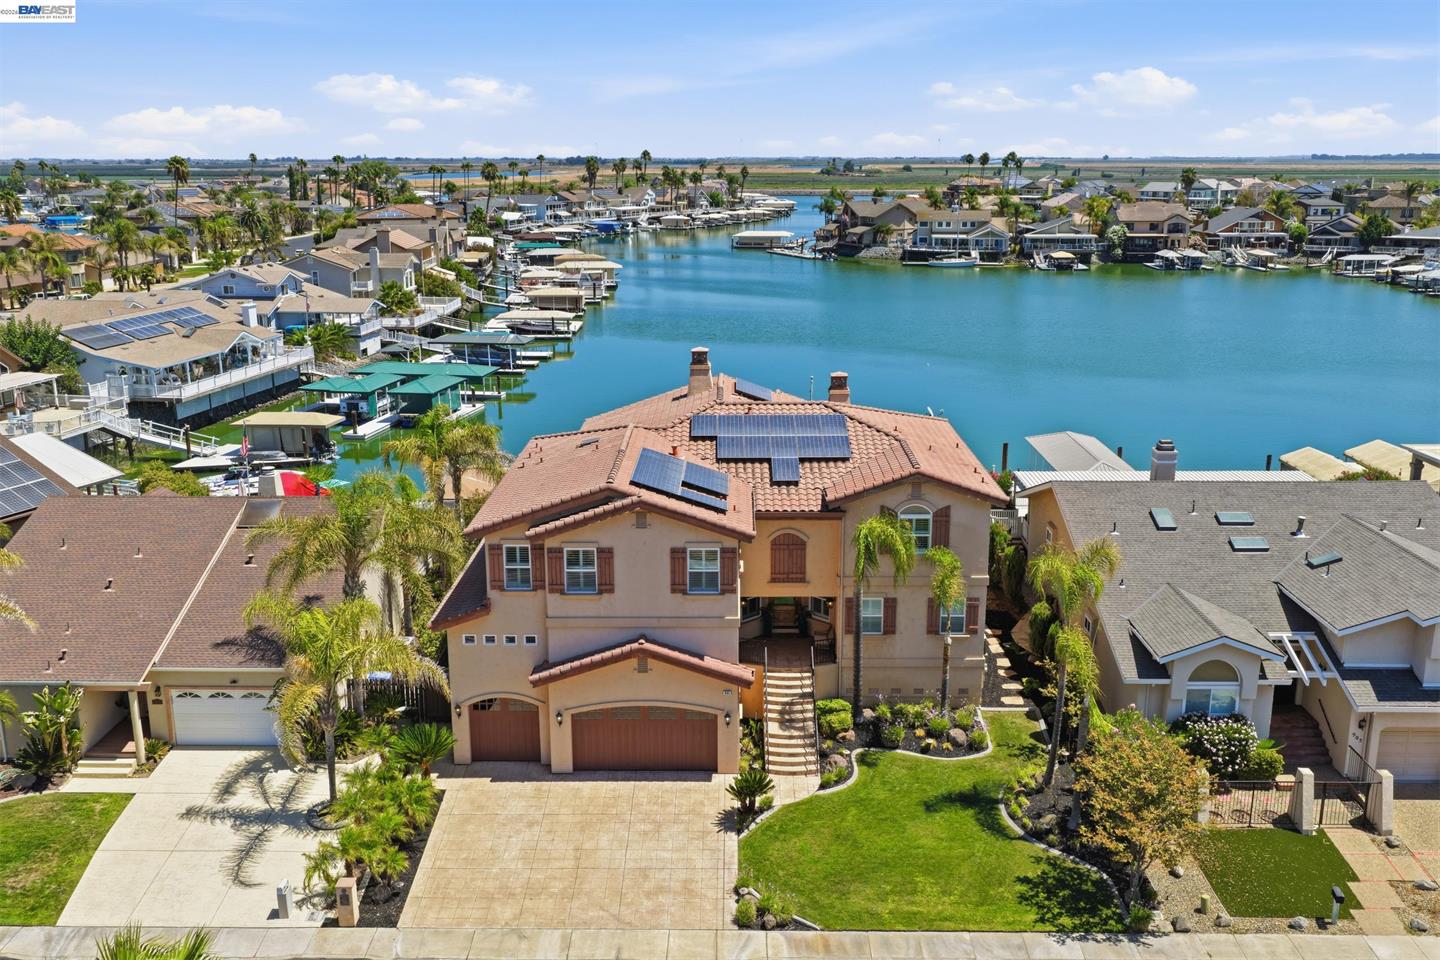
Discovery Bay Q3 2026 Market Report
Discovery Bay Q3 2026: 57 Closings, $745,780 Median, and a Per-Square-Foot Story That Runs Backward
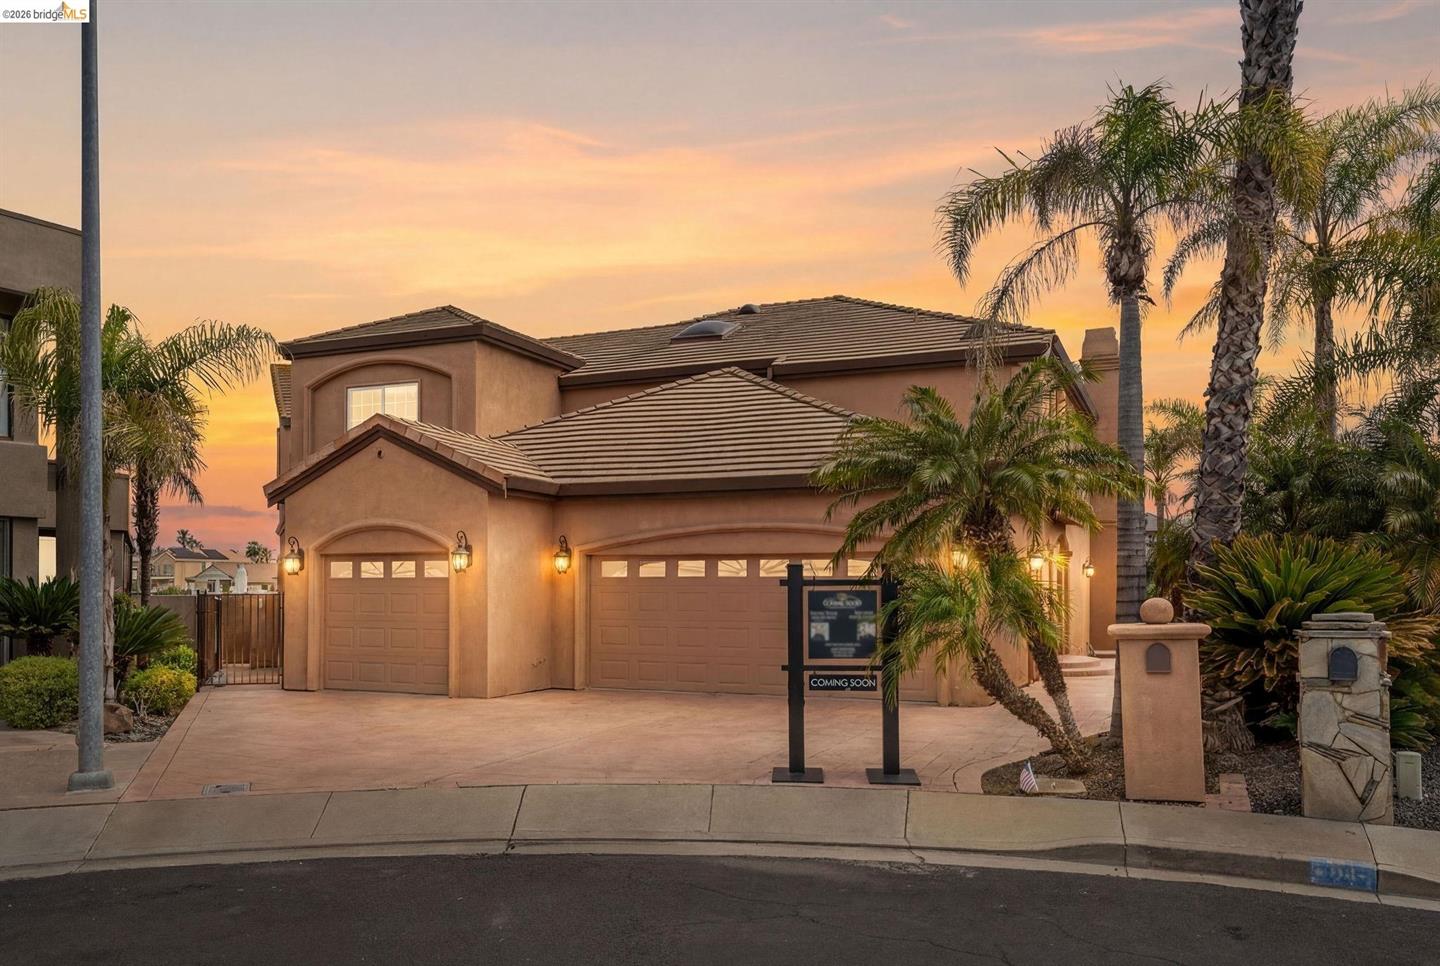
Discovery Bay September 2026 Market Report
Discovery Bay Posts 17 Closings in September as Median Price Slips to $730,000 — the Lowest in Six Months
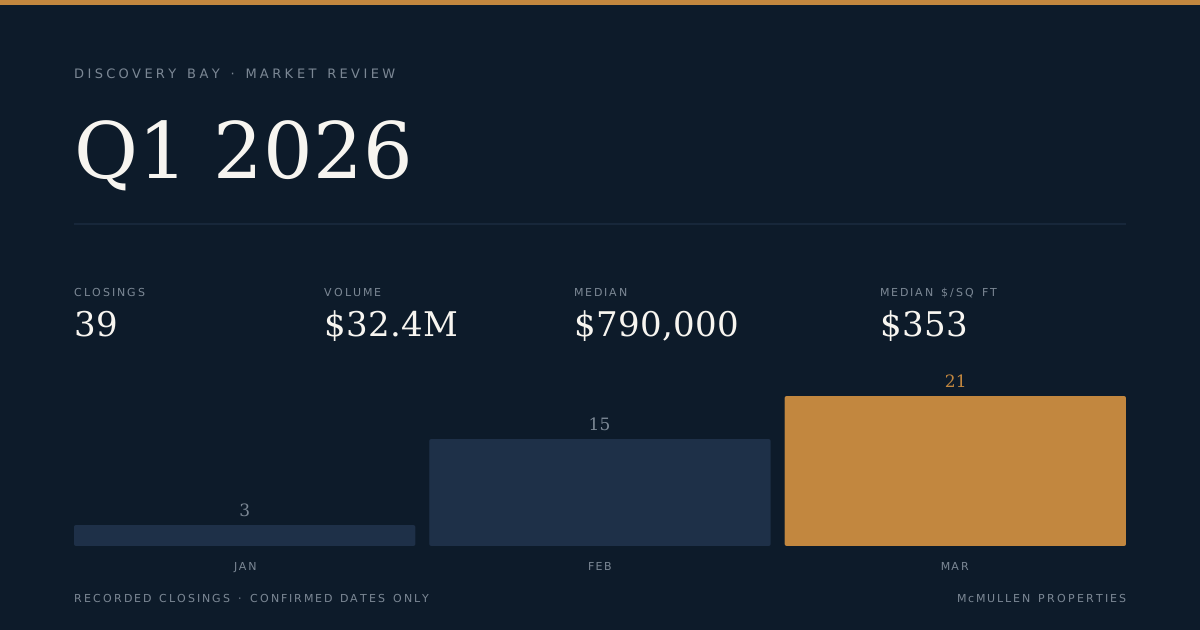
Discovery Bay Q1 2026 Market Report
Discovery Bay Posts $32.4M in Q1 2026 Closings as Median Price Slips $119K from January to March