Discovery Bay September 2026 Market Report
The period at a glance
| Metric | September 2026 |
|---|---|
| Closings | 17 |
| Median sale price | $730,000 |
| Median price per sq ft | $329 |
| Price range | $475,000 – $1,600,000 |
| Total volume | $12,571,668 |
| Active listings (end of period) | 78 |
| Pending listings (end of period) | 34 |
| Median active list price | $799,000 |
With 17 closings, this is a small sample — the figures that follow describe what actually transacted, not a statistically deep market read. The median sale price of $730,000 sits $65,500 below August's $795,500 and represents the softest monthly median in the six-month window. The median price per square foot of $329 is similarly the lowest since April's $334, after June and August both cleared $370+. Because the data source carries no list prices for most September transactions — only four of the seventeen carry list-price data — no broad assessment of pricing discipline against asking is possible.
Days-on-market figures are recorded for 12 of the 17 closings, so the speed picture is partial. Among those 12, the median was 22 days, two properties closed in under seven days, and three took more than 60 days — including one at 124 days and another at 112. The spread is wide enough that the median alone understates the variation present in the month.
The sales
List prices are unavailable for most closings this period; the source carries recorded sale prices only for 13 of 17 transactions.
| Address | Segment | Beds/Baths | Sq Ft | Sale Price | $/Sq Ft | DOM | Closed |
|---|---|---|---|---|---|---|---|
| 96 Shell Place | Single Family | 5/3.5 | 4,784 | $1,600,000 | $334 | 112 | Sep 11 |
| 5671 Arcadia Cir | Single Family | 6/4.5 | 4,679 | $945,000 | $202 | 17 | Sep 23 |
| 1771 Wilde Dr | Single Family | 5/3 | 2,888 | $870,000 | $301 | 51 | Sep 30 |
| 834 Blue Mesa Court | Single Family | 4/2.5 | 3,030 | $824,000 | $272 | 78 | Sep 7 |
| 2259 Newport Ct | Single Family | 4/3 | 2,136 | $797,000 | $373 | — | Sep 30 |
| 586 Lee Loop | Single Family | 4/3 | 2,178 | $745,780 | $342 | 124 | Sep 28 |
| 9261 Shearwater Circle | Single Family | 3/2.5 | 2,106 | $745,000 | $354 | 8 | Sep 2 |
| 1525 Coleridge Way | Single Family | 4/3 | 2,704 | $745,000 | $276 | 29 | Sep 4 |
| 5539 Arcadia Cir | Single Family | 5/4 | 3,333 | $730,000 | $219 | — | Sep 21 |
| 5470 Gold Creek Circle | Single Family | 4/2 | 1,865 | $688,888 | $369 | 20 | Sep 13 |
| 4890 Discovery Pt | Single Family | 3/2 | 2,018 | $630,000 | $312 | — | Sep 23 |
| 5585 Marlin Dr | Townhouse | 2/2.5 | 1,524 | $590,000 | $387 | 21 | Sep 26 |
| 3713 Yacht Dr | Single Family | 3/2.5 | 2,042 | $589,000 | $288 | 7 | Sep 19 |
| 4108 Regatta Dr | Single Family | 4/3 | 1,782 | $587,000 | $329 | — | Sep 30 |
| 1952 Cherry Hils Dr | Single Family | 2/2 | 1,632 | $530,000 | $325 | 4 | Sep 17 |
| 1601 Riverlake Rd | Townhouse | 2/2 | 1,289 | $480,000 | $372 | 23 | Sep 22 |
| 5679 Schooner Loop | Condominium | 2/2 | 1,248 | $475,000 | $381 | — | Sep 24 |
The roster shows all 17 closings recorded for September 2026.
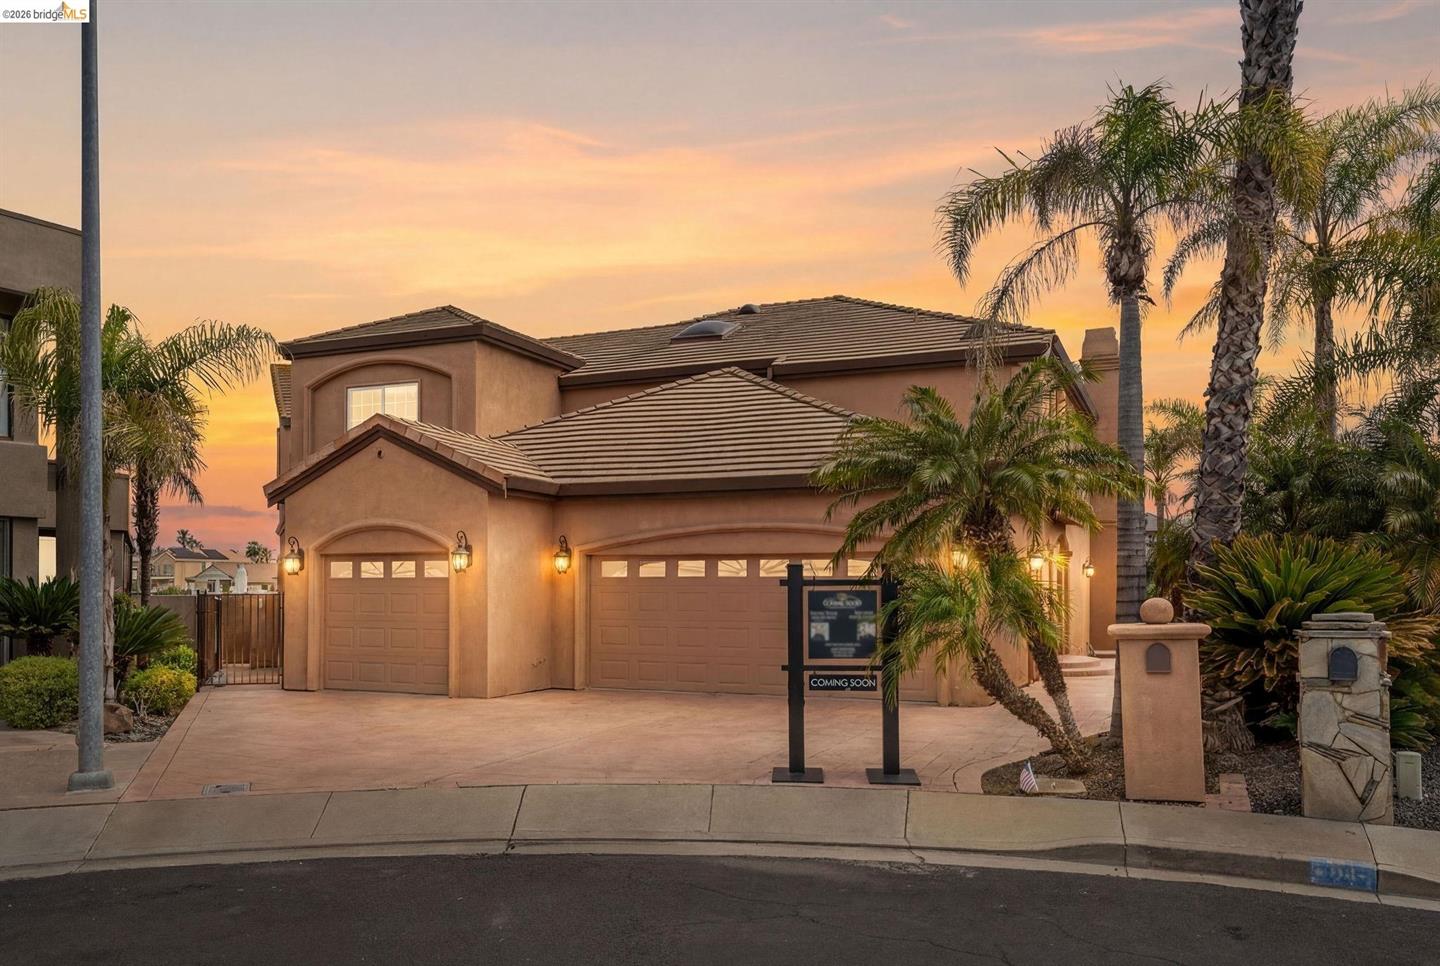
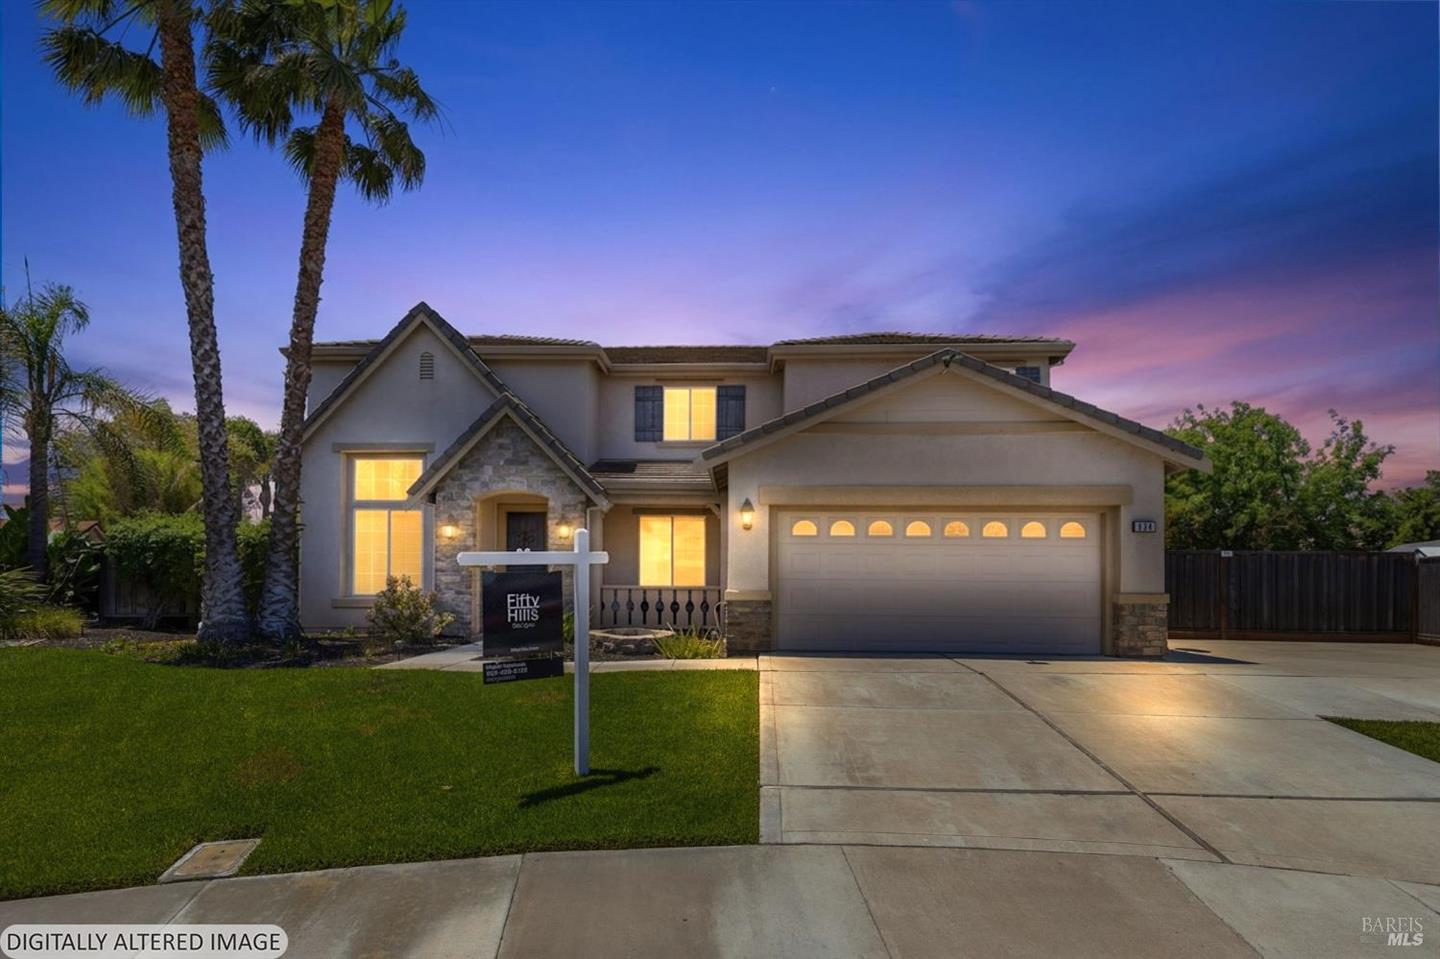
Four transactions anchor the narrative for the month. At the top, 96 Shell Place — a 4,784-square-foot, five-bedroom home built in 1990 — closed at $1,600,000 after 112 days on market. At $334 per square foot it sits at the upper end of the month's per-foot range and accounts for roughly 12.7 percent of total September volume on its own. The gap between it and the second-highest sale ($945,000 at 5671 Arcadia Cir) is $655,000 — a gap that does considerable work in pulling the mean price ($739,510) well above the median ($730,000).
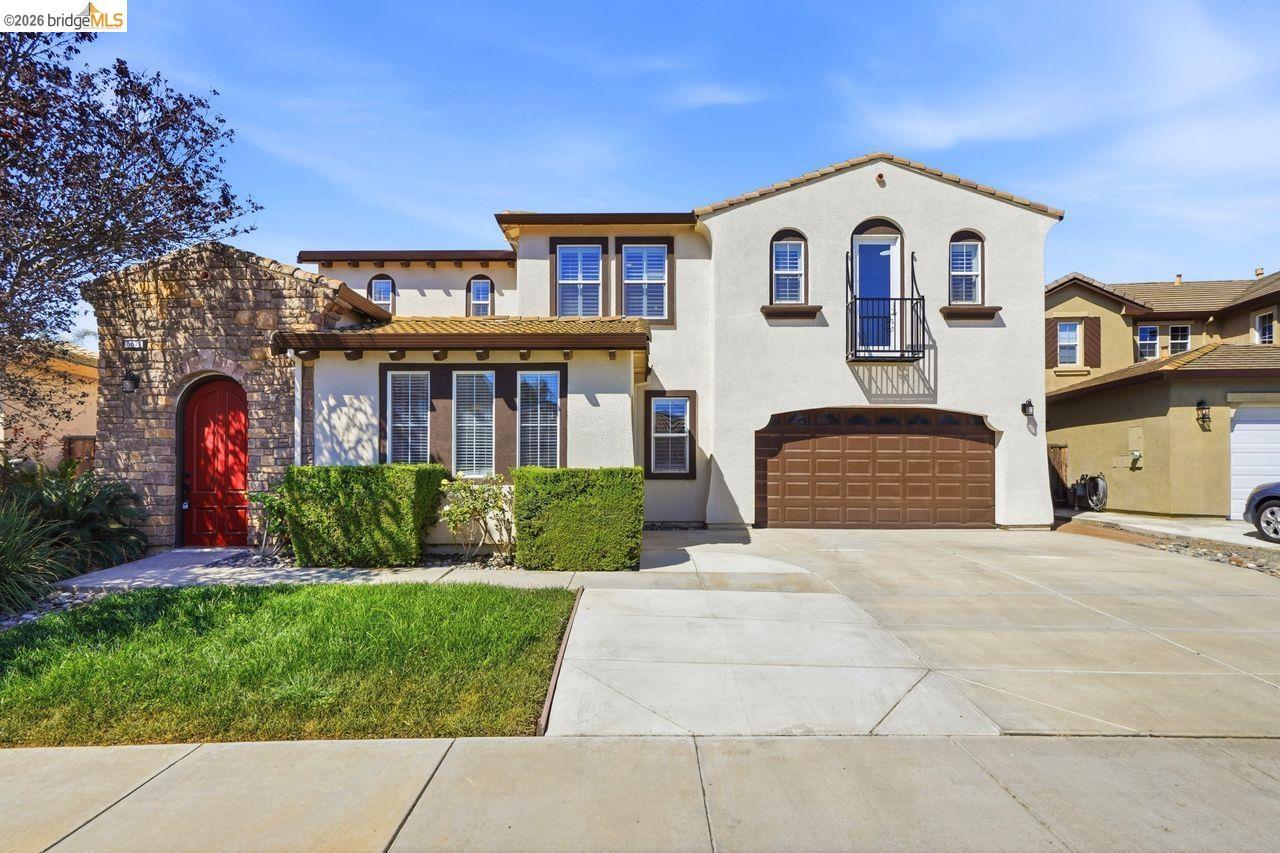
5671 Arcadia Circle, the month's second-highest close at $945,000, offered six bedrooms across 4,679 square feet — the largest footprint of the month — yet recorded the lowest price per square foot at $202. Without a year-built date in the record, the vintage is unknown, but the combination of scale and per-foot pricing suggests a floor plan that trades efficiency for room count.
At the other end, 4108 Regatta Drive is one of only four closings with a list price on file and closed at $587,000 against an asking price of $549,999 — a 6.7 percent premium, the largest in the month's list-price subset. The property is a 1,782-square-foot, four-bedroom home on a 4,050-square-foot lot, built in 1999, and it closed in the final day of the month with no days-on-market recorded.
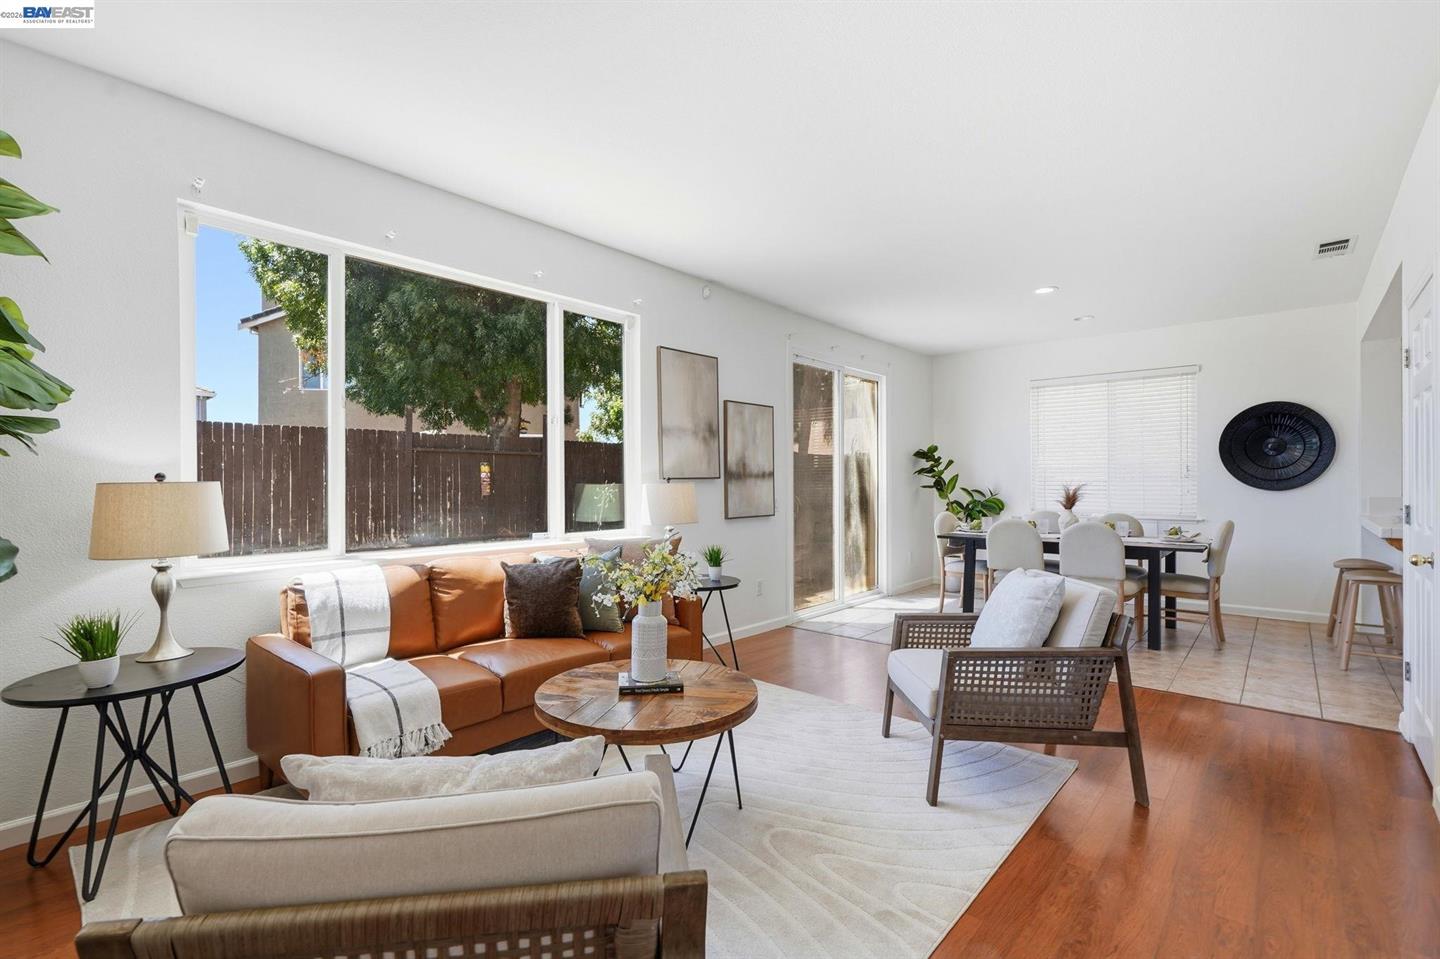
586 Lee Loop logged the month's longest recorded market time at 124 days before closing at $745,780 — a four-bedroom, 2,178-square-foot home with no year-built date in the record. It closed at $342 per square foot, above the month's overall median of $329, which separates time-on-market from price outcome here.
Where the market split
By segment
| Segment | Closings | Median Price | Median $/Sq Ft | Price Range |
|---|---|---|---|---|
| Single Family | 14 | $745,000 | $318 | $530,000 – $1,600,000 |
| Townhouse | 2 | $535,000* | $380 | $480,000 – $590,000 |
| Condominium | 1 | — | $381 | $475,000 (one sale) |
The townhouse median rests on two sales — treat it as a midpoint, not a trend.
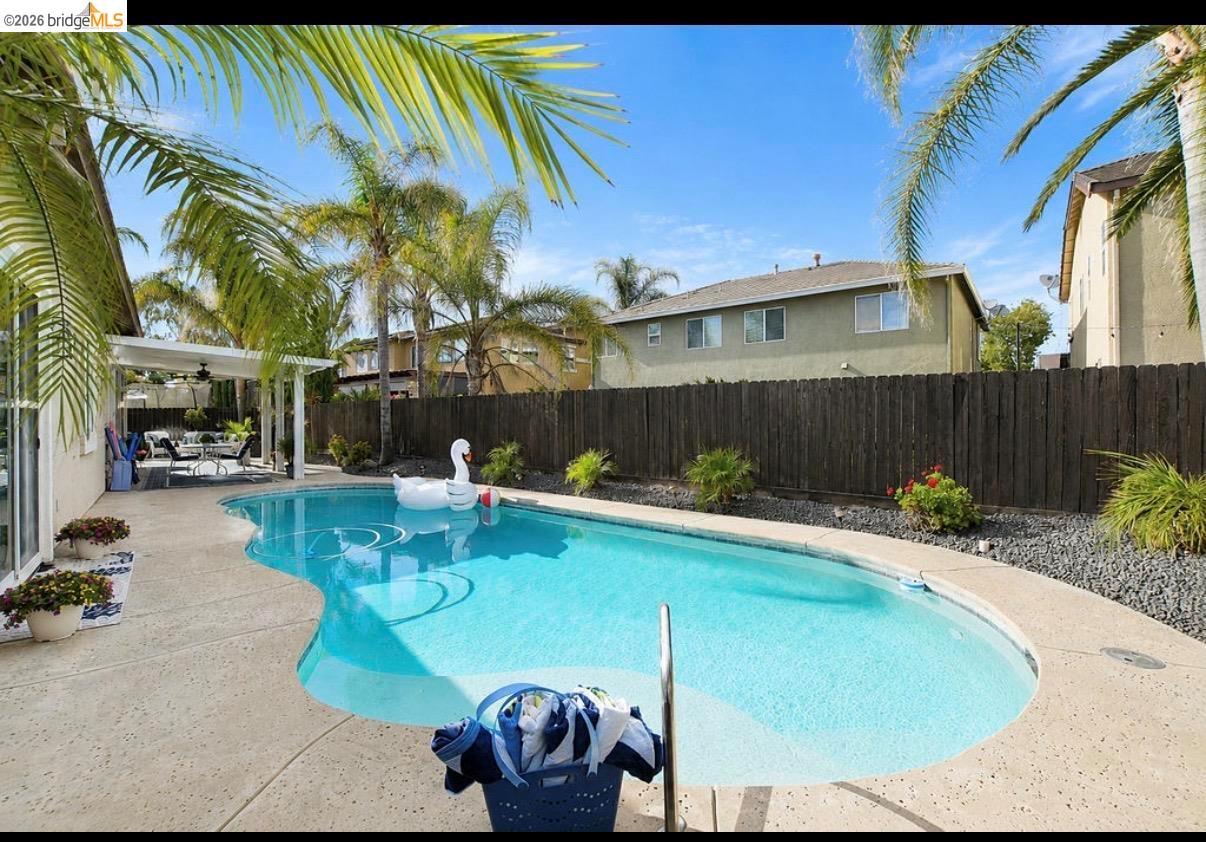
Single-family homes dominated September at 14 of 17 closings. Their median price of $745,000 (across 14 sales) and median per-foot figure of $318 trail the townhouse and condominium segments on a per-foot basis — the two townhouses averaged $380/sq ft and the single condominium closed at $381/sq ft. That inversion reflects size: single-family homes in this month skewed large, with a median of 2,157 square feet, while the townhouses and condo ranged from 1,248 to 1,524 square feet.
The condominium segment is a single sale — 5679 Schooner Loop, a 1,248-square-foot, two-bedroom unit built in 1987 that closed at $475,000, 5.6 percent above its $450,000 list price. No median is presented for one sale.
By price band
| Price Band | Closings | Median Sale Price | Median $/Sq Ft |
|---|---|---|---|
| Under $1M | 16 | $709,444 | $327 |
| $1.5M–$2M | 1 | $1,600,000 | $334 |
Sixteen of seventeen closings fell below $1,000,000. The band between $1,000,000 and $1,500,000 recorded no activity. The sole transaction above $1.5M — 96 Shell Place — sits in its own band with no comparable. The under-$1M median of $709,444 across 16 sales is the working price level for September.
Across the period
| Month | Closings | Median Price | Median $/Sq Ft |
|---|---|---|---|
| Apr 2026 | 16 | $709,500 | $334 |
| May 2026 | 18 | $784,250 | $330 |
| Jun 2026 | 13 | $789,000 | $387 |
| Jul 2026 | 21 | $765,000 | $344 |
| Aug 2026 | 19 | $795,500 | $378 |
| Sep 2026 | 17 | $730,000 | $329 |
The six-month sequence shows median price climbing from $709,500 in April to a peak of $795,500 in August before retreating to $730,000 in September — a pull-back of $65,500 from the prior month. The per-foot median follows a similar shape: April and May were in the low $330s, June and August spiked into the high $370s and $380s, and September returned to $329.
Closing volume has been variable: a low of 13 in June, a high of 21 in July, and September's 17 sits in the middle of that range. No year-ago comparison is available — the data source records no confirmed closings for September 2025.
The pattern worth watching is the divergence between June and September. June closed 13 transactions at $387/sq ft; September closed 17 transactions at $329/sq ft. Volume went up, per-foot pricing went down. The composition of what sold — more large single-family homes in September — accounts for part of that, since larger homes in this market have transacted at lower per-foot figures.
What it means
For sellers: Fourteen single-family homes found buyers in September at a median of $745,000. Active inventory stood at 78 at month's end with 34 pending, a ratio that means sellers are competing with a sizable active pool. Three of the month's 12 timed sales took longer than 60 days to close, and one sat for 124 days — so time on market varies considerably by property. The median active list price of $799,000 sits $69,000 above September's median closed price of $730,000; how that gap resolves in coming months is a question the October record will answer.
For buyers: September's range ran from $475,000 for a 1,248-square-foot condo to $1,600,000 for a 4,784-square-foot single-family home. The per-foot spread across all 17 sales was $202 (5671 Arcadia Cir) to $387 (5585 Marlin Dr), indicating that footprint, configuration, and condition produced materially different per-foot outcomes. Of the four closings with list prices on file, two sold over asking and two sold under — the median of that four-sale subset was 102.2 percent of list, with a maximum premium of 6.7 percent and a maximum discount of 2.9 percent. That is a thin slice of the month and cannot be generalized to the full 17 closings.
For owners not transacting: September's median of $730,000 is the lowest in the six-month window but sits $20,500 above April's $709,500, the earliest point in the trend data. The month-to-month move from August to September is a drop; the six-month arc is essentially flat with a mid-period rise. With 17 closings in a small community, a single outlier transaction can shift the monthly median noticeably — and September's $1.6M sale at Shell Place illustrates how far individual transactions can depart from that median in either direction.
Tim McMullen · CA DRE #02016832
[email protected] · (415) 691-9272
Press kit: figures & citation for this report →
More Discovery Bay market reports
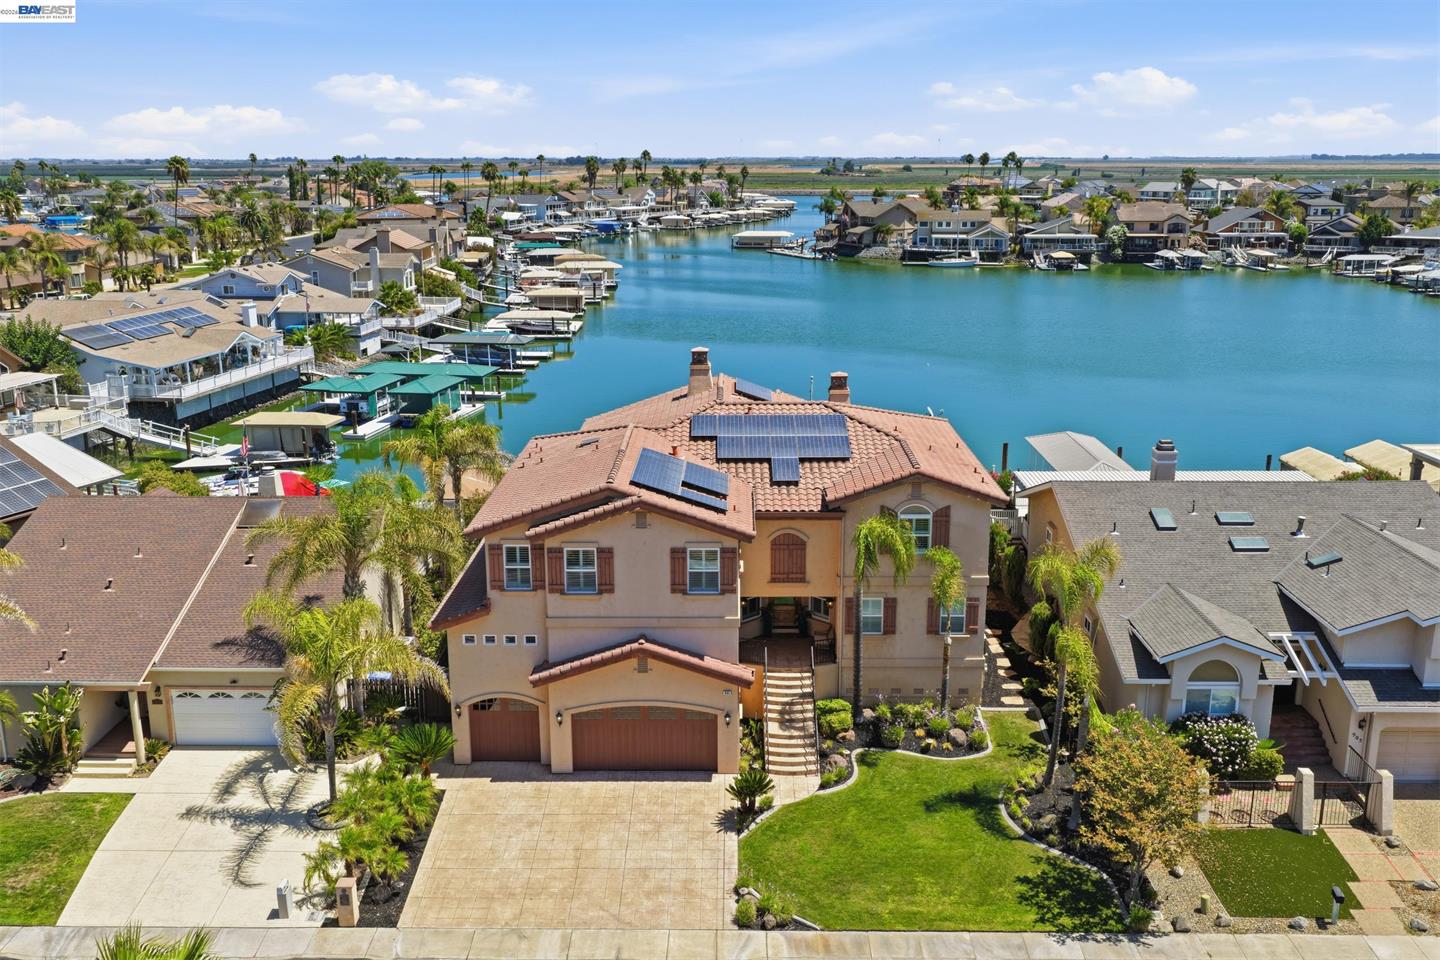
Discovery Bay Q3 2026 Market Report
Discovery Bay Q3 2026: 57 Closings, $745,780 Median, and a Per-Square-Foot Story That Runs Backward
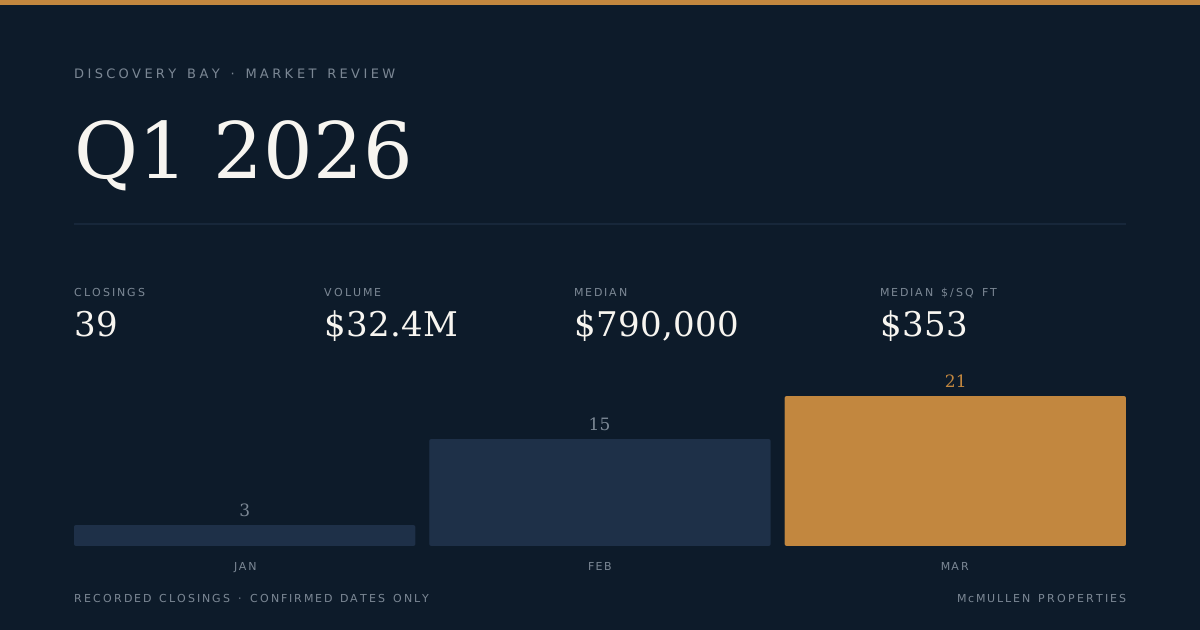
Discovery Bay Q1 2026 Market Report
Discovery Bay Posts $32.4M in Q1 2026 Closings as Median Price Slips $119K from January to March
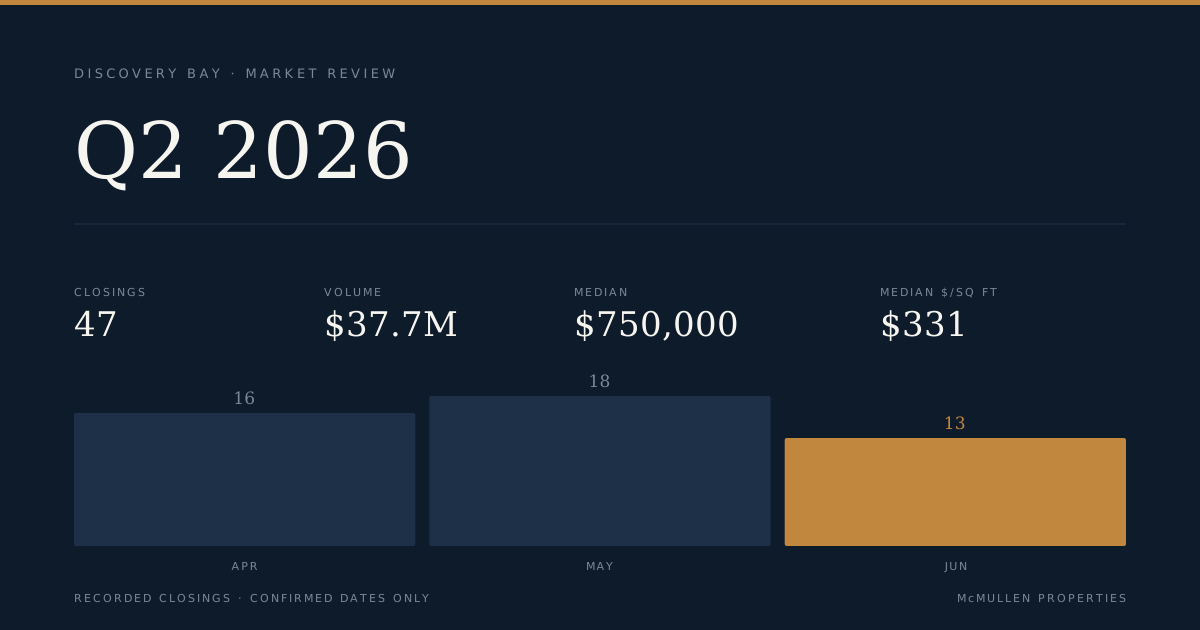
Discovery Bay Q2 2026 Market Report
Discovery Bay Q2 2026: 47 Closings, $37.7M in Volume, With a $1.1M Gap Between the Segment Medians