Discovery Bay Q1 2026 Market Report
The period at a glance
| Metric | Q1 2026 |
|---|---|
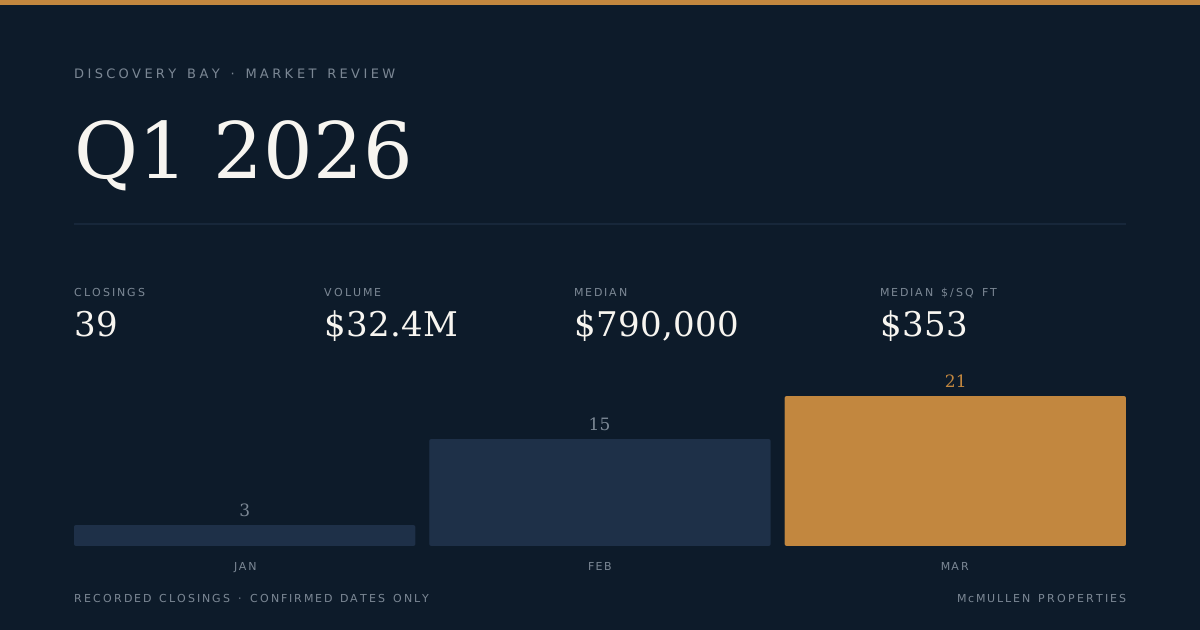
| Total closings | 39 |
| Total volume | $32,444,145 |
| Median sale price | $790,000 |
| Median price per sq ft | $353 |
| Median square footage | 2,229 |
| Price range | $533,000 – $1,525,000 |
| Median days on market | 30 (all 39 closings reported) |
| Closings with DOM under 7 days | 12 |
| Closings with DOM over 60 days | 18 |
List prices are not available in the source data for this period.
Thirty-nine transactions closed in Discovery Bay between January 1 and March 31, 2026, generating just over $32.4 million in total volume. The quarter-wide median of $790,000 sits across 38 single-family homes and one condominium — a sample thin enough on the condo side that a single-property figure carries no statistical weight. Days on market were recorded for all 39 closings, which is the full period count, so the speed data here is complete rather than partial. The median of 30 days is shaped by a hard split: 12 closings found buyers in under a week while 18 took longer than two months, with relatively little activity in between.
The quarter's internal tension is the gap between what sold fast and what sold at the top of the price range. The two highest-priced closings — $1.525M on Windward Point and $1.48M on Lighthouse Place — both recorded zero and four days on market respectively, while several homes in the $700K–$900K range sat for 80 to 272 days before closing. That spread suggests the waterfront and premium-positioned inventory found takers quickly, while a meaningful portion of the mid-range inventory required an extended market presence.
The sales
The roster below shows all 39 closings ranked by sale price, which equals the full period count.
| Address | Segment | Beds | Sq Ft | $/Sq Ft | Sale Price | DOM | Closed |
|---|---|---|---|---|---|---|---|
| 2031 Windward Pt | Single Family | 3 | 2,593 | $588 | $1,525,000 | 0 | Jan 13 |
| 3916 Lighthouse Place | Single Family | 4 | 3,088 | $479 | $1,480,000 | 4 | Mar 20 |
| 231 Discovery Bay Blvd | Single Family | 4 | 2,229 | $561 | $1,250,000 | 95 | Feb 18 |
| 301 Discovery Bay Blvd | Single Family | 3 | 2,290 | $519 | $1,189,000 | 226 | Feb 14 |
| 4174 Beacon PL | Single Family | 3 | 2,051 | $578 | $1,185,000 | 4 | Feb 10 |
| 1966 Windward Pt | Single Family | 5 | 3,145 | $312 | $980,000 | 96 | Mar 3 |
| 4375 Clipper Dr | Single Family | 4 | 2,356 | $393 | $925,000 | 0 | Mar 4 |
| 5653 Drakes Drive | Single Family | 3 | 1,445 | $623 | $900,000 | 64 | Feb 20 |
| 2233 Hampshire Dr | Single Family | 4 | 3,484 | $248 | $865,000 | 95 | Feb 23 |
| 6851 New Melones Cir | Single Family | 5 | 4,088 | $210 | $859,000 | 95 | Mar 21 |
| 531 Half Moon Ct | Single Family | 5 | 4,011 | $214 | $858,000 | 130 | Jan 30 |
| 8491 Pinehollow Cir | Single Family | 5 | 2,899 | $293 | $850,000 | 5 | Feb 14 |
| 2321 Sand Point Ct | Single Family | 3 | 1,524 | $558 | $850,000 | 4 | Jan 30 |
| 2101 Portside Ct | Single Family | 3 | 1,814 | $467 | $848,000 | 7 | Mar 25 |
| 4993 South Pt | Single Family | 3 | 1,606 | $511 | $820,000 | 0 | Mar 30 |
| 347 Astilbe Street | Single Family | 5 | 2,833 | $285 | $808,750 | 26 | Mar 27 |
| 4691 Spinnaker Way | Single Family | 3 | 1,543 | $522 | $805,000 | 17 | Mar 24 |
| 1240 Marina Cir | Single Family | 3 | 1,673 | $478 | $800,000 | 9 | Mar 30 |
| 1271 Discovery Bay Blvd | Single Family | 4 | 2,549 | $313 | $799,000 | 5 | Mar 20 |
| 906 Natoma Court | Single Family | 4 | 3,838 | $206 | $790,000 | 6 | Feb 10 |
| 6454 Green Castle Cir | Single Family | 4 | 3,425 | $230 | $789,000 | 80 | Feb 13 |
| 5684 Arcadia Cir | Single Family | 6 | 3,333 | $233 | $775,000 | 115 | Feb 14 |
| 1058 Bradbury Dr | Single Family | 4 | 2,178 | $347 | $754,899 | 98 | Feb 20 |
| 335 Astilbe Street | Single Family | 4 | 2,091 | $353 | $739,000 | 150 | Mar 24 |
| 2342 Winchester Loop | Single Family | 4 | 2,913 | $251 | $730,000 | 10 | Mar 5 |
| 605 Mystic Ct | Single Family | 3 | 1,886 | $387 | $730,000 | 77 | Feb 6 |
| 117 Cardinal Ln | Single Family | 3 | 2,583 | $281 | $725,000 | 66 | Mar 7 |
| 1154 Bradbury Dr | Single Family | 3 | 2,178 | $332 | $723,846 | 272 | Mar 27 |
| 3146 Castle Rock Loop | Single Family | 3 | 2,794 | $256 | $715,000 | 30 | Mar 3 |
| 870 Willow Lake Rd | Single Family | 3 | 1,788 | $392 | $700,000 | 83 | Mar 7 |
| 359 Astilbe Street | Single Family | 3 | 1,708 | $400 | $682,850 | 260 | Feb 28 |
| 516 Livingston Ct | Single Family | 3 | 2,259 | $299 | $675,000 | 9 | Mar 26 |
| 2230 Newport Ct | Single Family | 3 | 1,768 | $373 | $660,000 | 8 | Feb 17 |
| 2779 Cherry Hills Dr | Single Family | 3 | 1,992 | $326 | $650,000 | 144 | Mar 18 |
| 5726 Marlin Dr | Single Family | 2 | 2,308 | $273 | $630,000 | 18 | Mar 28 |
| 4043 Regatta Dr | Single Family | 4 | 1,713 | $368 | $629,800 | 38 | Mar 31 |
| 3748 Catamaran Ct | Single Family | 3 | 1,484 | $414 | $615,000 | 7 | Feb 22 |
| 5727 Cutter Loop | Condominium | 2 | 1,354 | $443 | $600,000 | 103 | Feb 22 |
| 1453 Cullen Dr | Single Family | 3 | 1,671 | $319 | $533,000 | 1 | Mar 23 |
Four transactions anchor the top of the quarter. 2031 Windward Point closed at $1,525,000 — the quarter's high — on the day it came to market (DOM recorded as zero), at $588 per square foot for a 1989-built, 2,593-square-foot home on a 7,200-square-foot lot. Four blocks away, 1966 Windward Point — a larger 3,145-square-foot, five-bedroom home built in 1991 — closed at $980,000 after 96 days, at $312 per square foot. The $545,000 gap between two addresses sharing the same street name and built two years apart reflects meaningful differences in size, configuration, and the time each spent on the market.
3916 Lighthouse Place, the quarter's second-highest close at $1,480,000, traded in four days at $479 per square foot across 3,088 square feet — the largest home in the top-five by price. Meanwhile, 301 Discovery Bay Blvd closed at $1,189,000 after sitting 226 days, the second-longest run in the entire quarter. The Bradbury Drive stretch produced the quarter's longest DOM: 1154 Bradbury Dr recorded 272 days before closing at $723,846, while the neighboring 1058 Bradbury Dr closed at $754,899 after 98 days. Both are newly built (2024 and 2025), which puts new construction's extended absorption times on plain display.
Where the market split
By segment
| Segment | Closings | Median Price | Median $/Sq Ft | Median Sq Ft | Price Range |
|---|---|---|---|---|---|
| Single Family | 38 | $794,500 | $350 | 2,244 | $533,000 – $1,525,000 |
| Condominium | 1 | n/a | n/a | 1,354 | $600,000 |
With 38 of 39 closings in the single-family segment, the quarter is essentially a single-family story. The one condominium — 5727 Cutter Loop, a 1,354-square-foot, two-bedroom unit built in 1986 that closed at $600,000 after 103 days — is the sole data point in its category. A single sale produces no median; the range is $600,000 to $600,000 and the $443 per square foot figure stands alone without a comparison set.
Within single-family, the 38-sale median of $794,500 at $350 per square foot sits across a wide footprint. Square footage ranged from 1,445 to 4,088, and price per square foot ranged from $206 (906 Natoma Court, 3,838 sq ft, built 2006) to $623 (5653 Drakes Drive, 1,445 sq ft, built 1986). The inverse relationship between size and price per square foot appeared repeatedly: the five largest homes in the roster all priced below $330 per square foot, while the five smallest (under 1,700 sq ft) averaged above $500 per square foot.
By price band
| Price Band | Closings | Median $/Sq Ft |
|---|---|---|
| Under $1M | 34 | $329 |
| $1M – $1.5M | 4 | $540 |
| $1.5M – $2M | 1 | $588 |
Eighty-seven percent of the quarter's closings — 34 of 39 — landed below $1 million, at a median of $329 per square foot. The four closings in the $1M–$1.5M band (231 Discovery Bay Blvd, 301 Discovery Bay Blvd, 4174 Beacon Pl, and 3916 Lighthouse Place) averaged substantially larger at $540 per square foot, a 64% premium over the sub-$1M median rate. The lone closing above $1.5M (2031 Windward Pt) carried the quarter's highest per-square-foot rate at $588.
The $1.5M–$2M band had one transaction, so no median applies; the range is a single point. The $1M–$1.5M band with four closings produces a median figure, though readers should note its limited sample. The spread in $/sq ft across bands — from $329 to $588 — reflects both location premiums and the size inversion noted above: the lower band contained most of the quarter's largest homes by square footage.
Across the quarter
| Month | Closings | Median Price | Median $/Sq Ft |
|---|---|---|---|
| January 2026 | 3 | $858,000 | $558 |
| February 2026 | 15 | $789,000 | $387 |
| March 2026 | 21 | $739,000 | $326 |
| Q1 Total / Median | 39 | $790,000 | $353 |
Volume accelerated sharply across the quarter: three closings in January, fifteen in February, twenty-one in March. January's three-sale median of $858,000 at $558 per square foot rested on a very small sample — those three closings included the quarter's top price ($1,525,000 on Windward Point) — so January's figures carry less statistical weight than the February and March figures based on 15 and 21 closings respectively.
From February to March, the median price moved from $789,000 to $739,000, a decline of $50,000, while median price per square foot dropped from $387 to $326. Across the full January-to-March arc the median price fell $119,000 and the median rate fell $232 per square foot, though the January starting point is shaped by a thin, high-priced sample. The direction of travel from February to March — the two months with material sample sizes — was downward in both measures as volume increased. Whether this reflects a shift in the mix of homes closing, a shift in pricing, or both cannot be determined from the closing record alone.
What it means
For sellers
The quarter produced $32.4 million in closed volume across 39 transactions, with the single-family segment carrying virtually all of it. Twelve of 39 closings recorded fewer than seven days on market; eighteen recorded more than sixty. The gap between those two groups is not random noise — the homes that closed fastest were concentrated in the upper price tiers, while new construction on Astilbe Street and Bradbury Drive logged some of the quarter's longest DOM figures (150, 260, and 272 days). Sellers whose properties sat beyond the 60-day mark closed at rates that, in most cases, sat in the lower half of the quarter's price distribution.
For buyers
The under-$1M segment — where 87% of the quarter's transactions occurred — carried a median rate of $329 per square foot across a 34-sale sample. That segment's price range ran from $533,000 to just under $1 million, with meaningful variation in size: a buyer at $850,000 could land a 1,524-square-foot home (2321 Sand Point Ct) or a 2,899-square-foot home (8491 Pinehollow Cir) depending on configuration and age. The 18 closings that required more than 60 days on market were spread across the $533K–$980K range, indicating extended availability for a portion of sub-$1M inventory during the quarter.
For owners not transacting
The quarter's 39 closings established a recorded price range of $533,000 to $1,525,000 for Discovery Bay residential property, with a whole-quarter median of $790,000. The month-by-month record shows increasing transaction volume alongside declining median prices and median per-square-foot rates in the two months with material sample sizes. The single condominium closing at $600,000 provides no basis for comparison within that segment; owners of attached product have one data point from the quarter.
Tim McMullen · Tim McMullen, Broker · CA DRE #02016832
[email protected] · (415) 691-9272
Press kit: figures & citation for this report →
More Discovery Bay market reports
Discovery Bay Q3 2026 Market Report
Discovery Bay Q3 2026: 57 Closings, $745,780 Median, and a Per-Square-Foot Story That Runs Backward
Discovery Bay September 2026 Market Report
Discovery Bay Posts 17 Closings in September as Median Price Slips to $730,000 — the Lowest in Six Months
Discovery Bay Q2 2026 Market Report
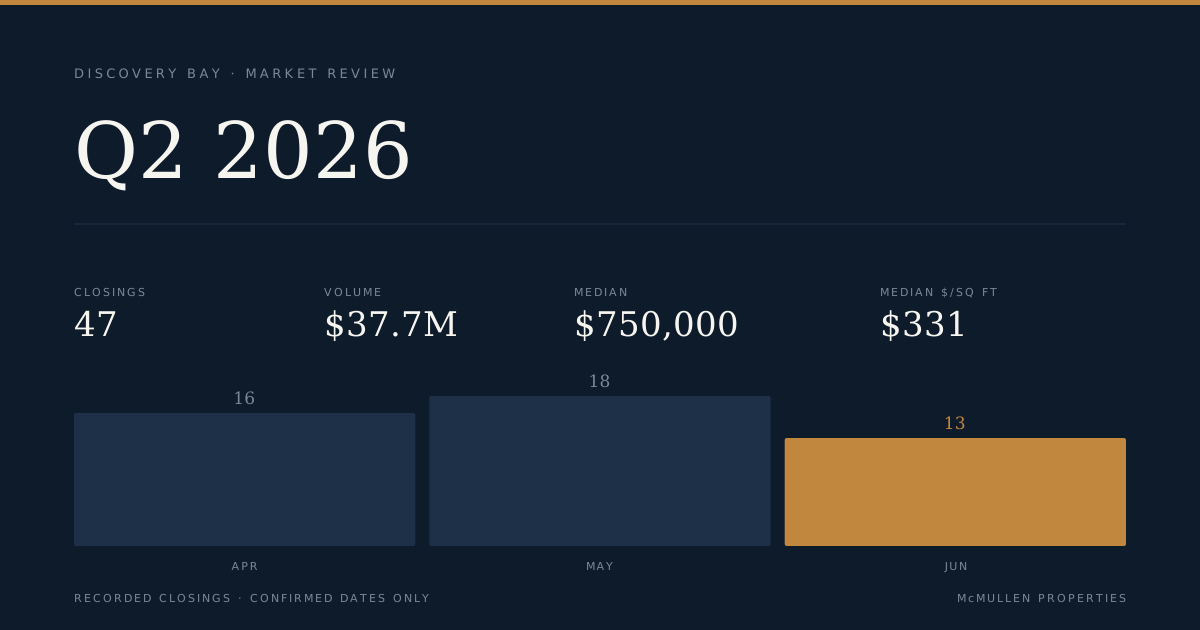
Discovery Bay Q2 2026: 47 Closings, $37.7M in Volume, With a $1.1M Gap Between the Segment Medians