Discovery Bay August 2026 Market Report
The month at a glance
| Metric | August 2026 |
|---|---|
| Closings | 18 |
| Total volume | $15,924,899 |
| Median sale price | $822,750 |
| Mean sale price | $884,717 |
| Price range | $500,000 – $1,650,000 |
| Median price per sq ft | $386 |
| Median square footage | 2,295 |
| Median lot size | 7,140 sq ft |
| Median DOM (18 of 18 closings) | 53 days |
| Active listings | 78 |
| Pending | 23 |
| Median active list price | $799,000 |
| Year-over-year comparison | Unavailable — no confirmed closings recorded for August 2025 |
All eighteen closings in August were single-family homes, so segment breakdown and overall market figures are identical. The median sale price of $822,750 sits $23,750 above the median active list price of $799,000, though that comparison carries a limit: the active-list figure reflects current asking prices, not transaction prices, and the two populations are different homes. The more relevant internal spread is the $1,150,000 gap between the $500,000 floor and the $1,650,000 ceiling — a range wide enough that the median tells only part of the story.
The mean of $884,717 runs $62,000 above the median, a gap driven by four closings above $1,000,000 pulling the average upward. Days on market were recorded for all 18 closings. The median was 53 days, but the distribution was not clustered: two homes closed in under seven days, two more in eight to twenty-one days, seven in twenty-two to sixty days, and seven took more than sixty days — including two that sat for 117 and 122 days, and one each at 159 and 162 days.
Every sale this month
| Address | Closed | Beds | Baths | Sq Ft | $/Sq Ft | Sale Price | DOM | Year Built |
|---|---|---|---|---|---|---|---|---|
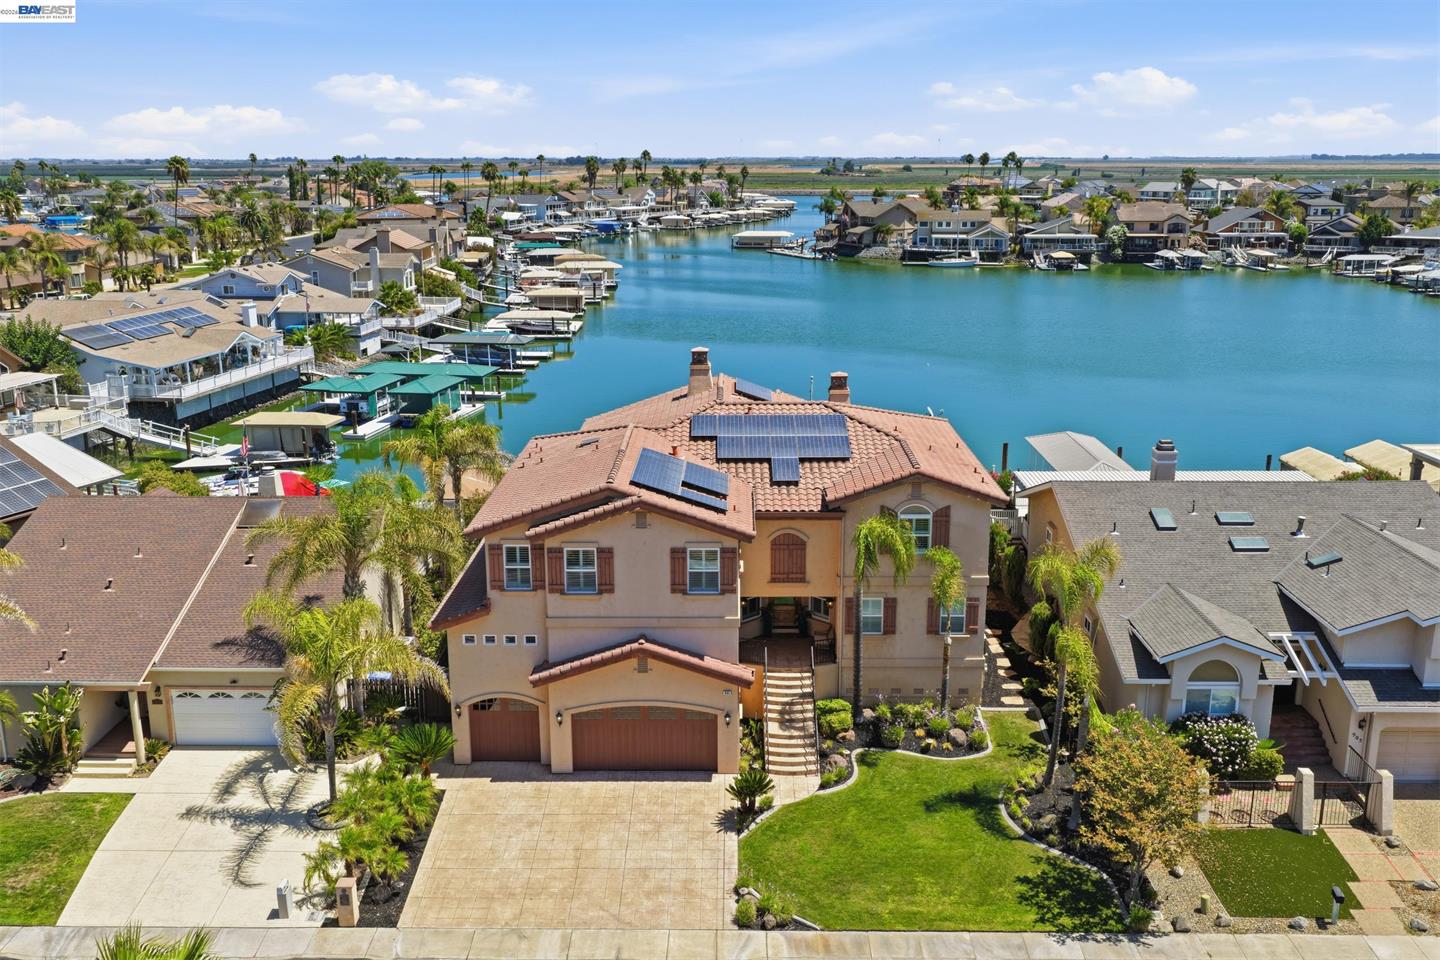
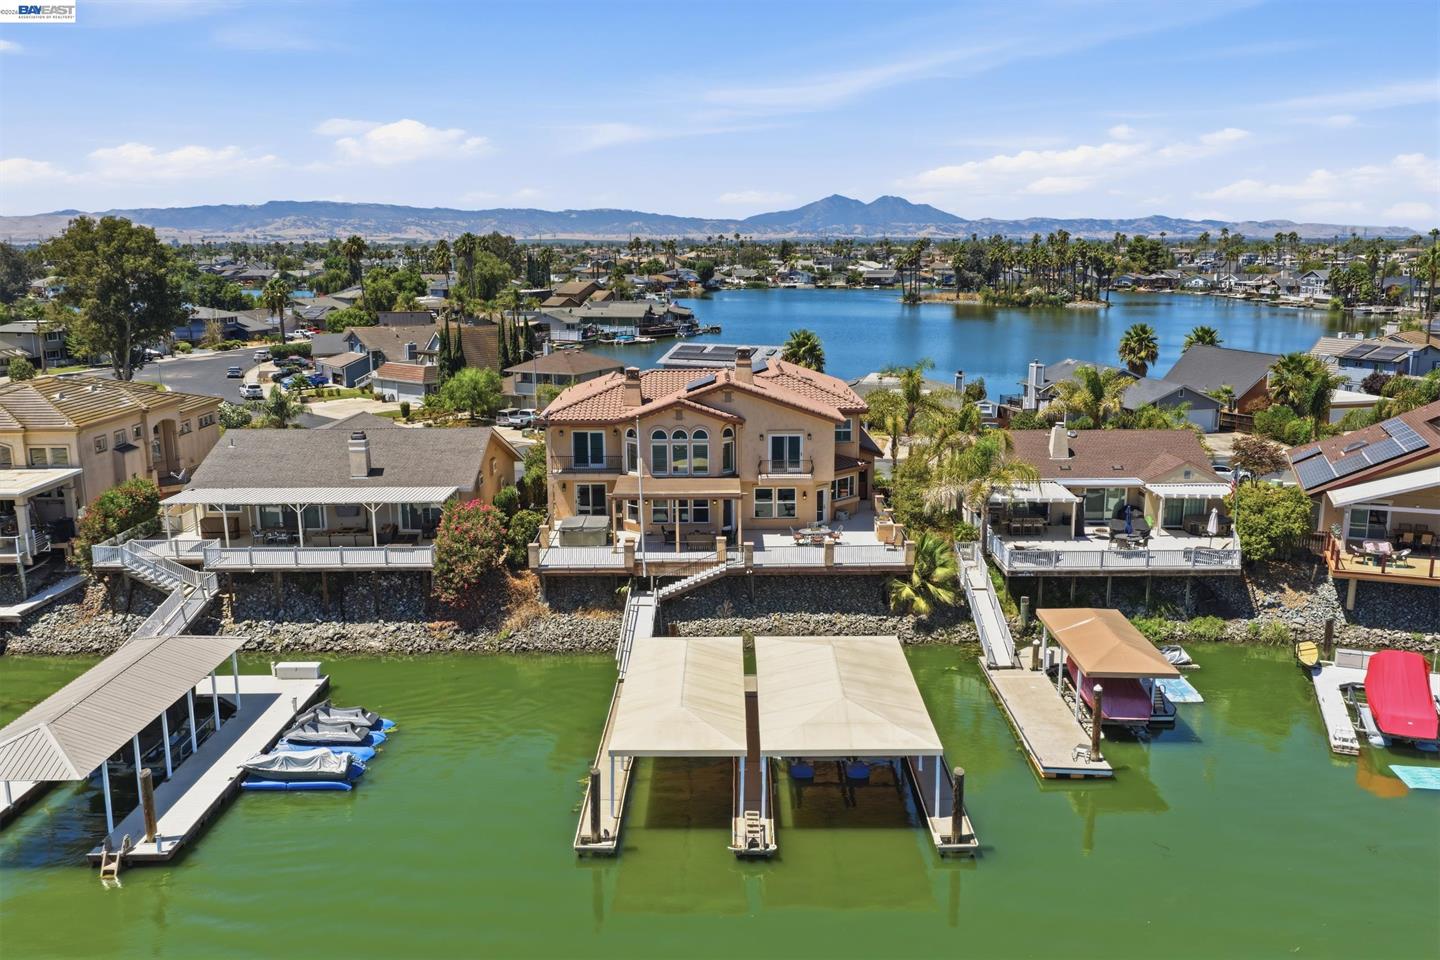
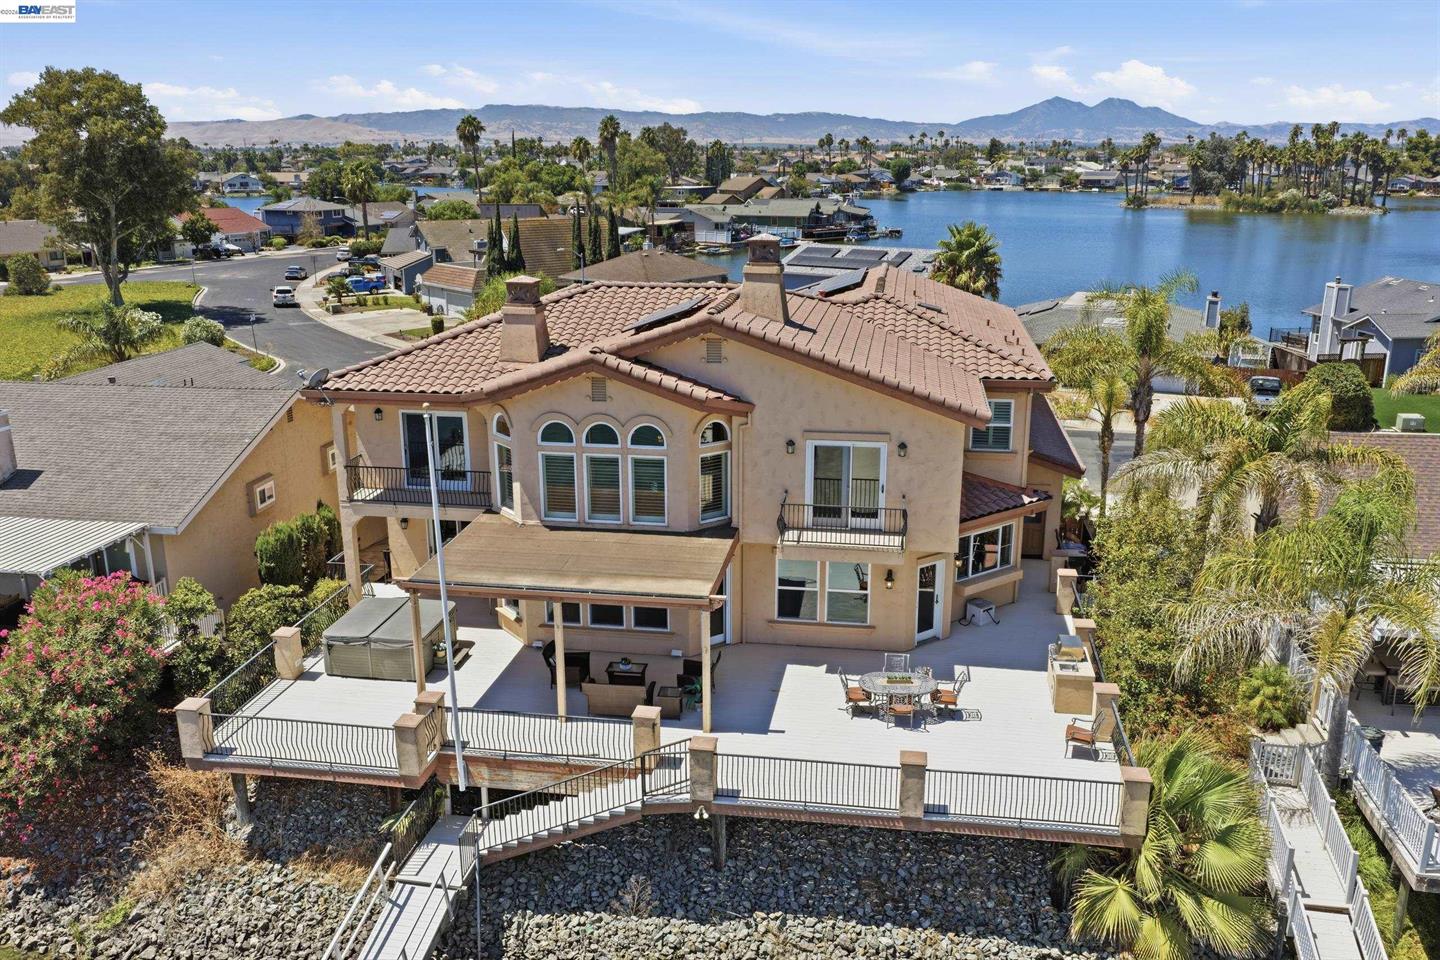
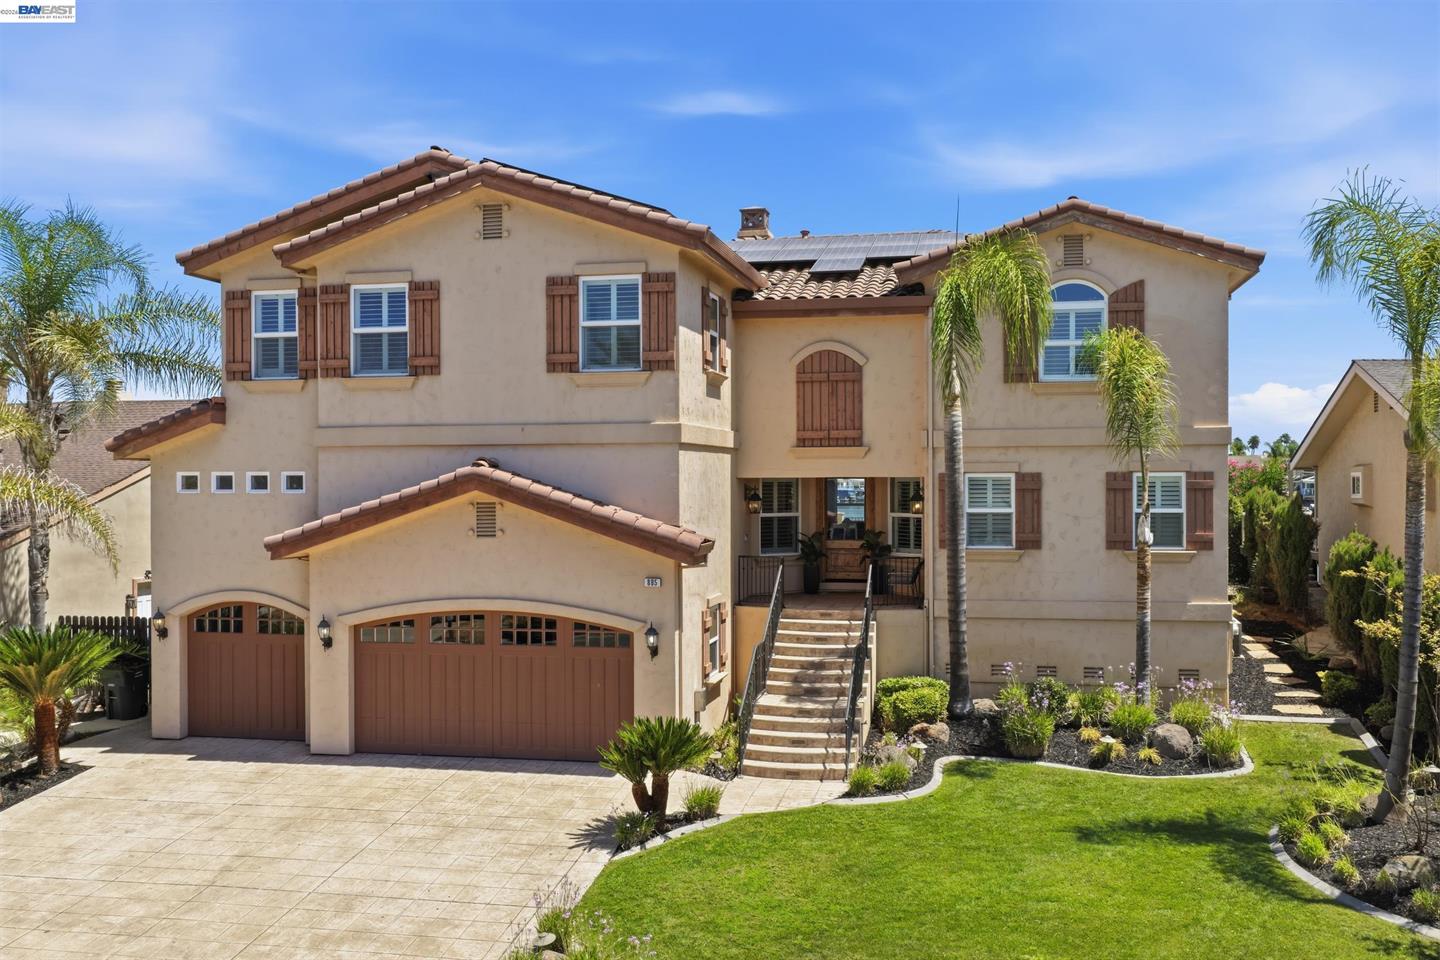
| 885 Willow Lake Rd | Aug 27 | 5 | 3.5 | 4,062 | $406 | $1,650,000 | 5 | 2001 |
| 5761 Salmon Ct | Aug 27 | 4 | 2.5 | 2,711 | $535 | $1,450,000 | 162 | 1986 |
| 5621 Starboard Dr | Aug 27 | 3 | 2 | 2,284 | $482 | $1,100,000 | 101 | 1985 |
| 4813 South Pt | Aug 28 | 4 | 3 | 2,871 | $373 | $1,070,000 | 79 | 1981 |
| 1215 Willow Lake Rd | Aug 28 | 3 | 2.5 | 1,682 | $624 | $1,050,000 | 36 | 1981 |
| 4839 Cabrillo Pt | Aug 26 | 3 | 2 | 1,763 | $547 | $965,000 | 98 | 1977 |
| 840 Rainbow Ct | Aug 3 | 3 | 3 | 2,342 | $378 | $885,000 | 47 | 2015 |
| 1760 Anchorage Way | Aug 17 | 3 | 2.5 | 1,668 | $515 | $859,000 | 52 | 1988 |
| 1794 Seal Way | Aug 21 | 3 | 2 | 2,153 | $395 | $850,000 | 22 | 1987 |
| 5282 Fern Ridge Cir | Aug 24 | 5 | 2.5 | 3,629 | $219 | $795,500 | 159 | 2005 |
| 1915 Edgeview Way | Aug 19 | 4 | 3 | 2,585 | $290 | $750,000 | 12 | 1988 |
| 5501 Riverlake Road | Aug 18 | 4 | 2.5 | 2,305 | $310 | $715,000 | 58 | 1979 |
| 2466 Yosemite Way | Aug 18 | 4 | 2.5 | 2,613 | $260 | $680,000 | 2 | 2002 |
| 1755 Surfside Ct | Aug 13 | 3 | 2 | 1,689 | $401 | $677,500 | 53 | 1985 |
| 2459 Del Mar Ct | Aug 22 | 3 | 2.5 | 2,368 | $279 | $659,999 | 122 | 1991 |
| 705 Pardee Ct | Aug 17 | 3 | 2 | 1,886 | $345 | $649,900 | 44 | 2015 |
| 3960 Regatta Drive | Aug 27 | 3 | 2 | 1,484 | $416 | $618,000 | 11 | 1996 |
| 5260 Laguna Court | Aug 6 | 3 | 2 | 1,692 | $296 | $500,000 | 117 | 1980 |
List prices were not recorded for any of the 18 closings. Above/below-ask analysis is unavailable.
Four transactions define the month's spread. At the top, 885 Willow Lake Rd closed at $1,650,000 — the largest home in the month's roster at 4,062 square feet — and did so in five days, the second-fastest close of the month. Five days elapsed between first list and close; the price per square foot landed at $406, in line with the middle of the $1M–$1.5M band rather than where its absolute price placed it, which suggests size was the primary driver of the total.
At the other extreme, 5260 Laguna Court closed at $500,000 — the only sub-$600,000 transaction — after 117 days on market. At 1,692 square feet on a 7,200-square-foot lot, built in 1980, it recorded $296 per square foot, the third-lowest rate in the month.
The most statistically unusual transaction was 5761 Salmon Ct, which closed at $1,450,000 after 162 days on market — the longest run of the month by three days. At 2,711 square feet, its $535 per square foot was the second-highest rate recorded in August, exceeded only by 1215 Willow Lake Rd's $624. A 1986-built home at that rate in the $1M–$1.5M band is worth noting alongside its 162-day timeline: these two facts sit in the same record without explanation.
5282 Fern Ridge Cir is the floor of the per-square-foot range: $219, on a 3,629-square-foot home that closed at $795,500 after 159 days. That $219 figure is the lowest $/sq ft of the month by a margin of $41. The home is the largest in the sub-$1M band, which partly explains the compression; it is also the newest construction in that band, built in 2005.
Where the market split
By segment
| Segment | Sales | Median Price | Median $/Sq Ft | Median Sq Ft | Price Range |
|---|---|---|---|---|---|
| Single Family | 18 | $822,750 | $386 | 2,295 | $500,000 – $1,650,000 |
All 18 closings were single-family homes. No condominiums, townhomes, or other segments recorded a close in August. Segment-level comparison is not available within this month's data.
By price band
| Price Band | Sales | Median Price | Median $/Sq Ft |
|---|---|---|---|
| Under $1M | 13 | $715,000 | $345 |
| $1M – $1.5M | 4 | $1,085,000 | $508 |
| $1.5M – $2M | 1 | $1,650,000 | $406 |
Thirteen of eighteen closings — 72 percent — fell under $1,000,000. That band's median of $715,000 and $345 per square foot are both well below the all-month figures of $822,750 and $386, confirming that the four closings in the $1M–$1.5M band pull the overall median meaningfully upward.
The $1M–$1.5M band (four sales) recorded a median of $508 per square foot — $163 higher than the sub-$1M band's median. That differential reflects a consistent pattern within this month's data: the homes that closed between $1M and $1.5M were smaller in square footage (median size not separately tabulated, but the four homes range from 1,682 to 2,871 sq ft), meaning each dollar of total price buys less space, not more.
The $1.5M–$2M band contains one closing — 885 Willow Lake Rd at $1,650,000. A single transaction produces no median. The range for this band is $1,650,000 to $1,650,000 and the $/sq ft is $406.
No closings were recorded above $2,000,000.
Against asking
List prices were not recorded in the transaction data for any of the 18 closings this month. The over-list, at-list, under-list, and median-percentage-of-list figures are all absent. No above/below-ask analysis is possible from this record, and no premium or discount figures are cited. Readers who need that context should request it from the listing brokerage or the MLS pull directly.
What can be said from the record: the spread between the fastest and slowest closings is 160 days (2 days vs. 162 days). Among the seven homes that took more than 60 days, sale prices ranged from $500,000 to $1,450,000 — both extremes of the month's price range are represented in the slow-mover group. Among the two that closed in under seven days, prices were $680,000 and $1,650,000. Speed and price did not track together in a simple direction this month.
Six months in context
| Month | Closings | Median Price | Median $/Sq Ft |
|---|---|---|---|
| Mar 2026 | 21 | $739,000 | $326 |
| Apr 2026 | 16 | $709,500 | $334 |
| May 2026 | 18 | $784,250 | $330 |
| Jun 2026 | 13 | $789,000 | $387 |
| Jul 2026 | 21 | $765,000 | $344 |
| Aug 2026 | 18 | $822,750 | $386 |
The six-month median price range runs from $709,500 (April) to $822,750 (August), a spread of $113,250. August's $822,750 is the highest median price in the six-month window. The median $/sq ft in August ($386) matches June's $387 as the joint-highest readings in the window, both sitting roughly $52–$60 above the March–May range of $326–$334.
Closing volume has been variable: 21, 16, 18, 13, 21, 18 across the six months, with no sustained directional move. June's 13 closings was the low; March and July each reached 21. August's 18 is a middle figure.
The median price moved down from March to April ($739,000 to $709,500), recovered through May and June, dipped slightly in July ($765,000), and reached the six-month high in August. The $/sq ft series shows a similar shape — a low plateau from March through May, a jump in June, a retreat in July, and a recovery in August. Whether the June–August $/sq ft readings represent a persistent shift or a two-month oscillation cannot be determined from six months of data alone.
Year-over-year comparison is unavailable. No confirmed closings were recorded for August 2025.
What it means
For sellers: The August median of $822,750 is the highest in the six-month record, reached on 18 closings. The active inventory stands at 78 homes — 4.3 times the number that closed in August. The median active list price of $799,000 is $23,750 below the August closing median, though this comparison has limits noted above. Seven of the 18 homes that did close took more than 60 days to do so, and two exceeded 150 days. These two facts — a six-month-high median and a meaningful share of slow-moving inventory — exist simultaneously in this month's record.
For buyers: Thirteen of eighteen closings fell under $1,000,000, with a sub-$1M median of $715,000 and a median $/sq ft of $345 in that band. The active inventory of 78 homes at a median asking price of $799,000 represents the current supply picture. The 23 pending sales indicate how many homes are currently under contract. Days on market for closed homes ranged from 2 to 162, with a median of 53, drawn from all 18 closings.
For owners not transacting: The August median of $822,750 is $57,750 above July's $765,000, and $83,750 above the six-month low set in April. The median $/sq ft of $386 in August is the second-highest figure in the six-month window, one dollar below June's $387. These are the numbers the transaction record produced this month. What they represent for any individual property depends on that property's specifics, and the transaction record is the only source this report draws from.
Tim McMullen · Tim McMullen, Broker · CA DRE #02016832
[email protected] · (415) 691-9272
Press kit: figures & citation for this report →
More Discovery Bay market reports
Discovery Bay Q3 2026 Market Report
Discovery Bay Q3 2026: 57 Closings, $745,780 Median, and a Per-Square-Foot Story That Runs Backward
Discovery Bay September 2026 Market Report
Discovery Bay Posts 17 Closings in September as Median Price Slips to $730,000 — the Lowest in Six Months
Discovery Bay Q1 2026 Market Report
Discovery Bay Posts $32.4M in Q1 2026 Closings as Median Price Slips $119K from January to March